Microsoft Power BI is a cloud-based tool that helps businesses visualize and analyze data through interactive dashboards and reports. Our Microsoft Power BI consulting services streamline integration and ensure you unlock its full potential for real-time insights and better decision-making.
How Microsoft Power BI Helps Businesses with Diverse Data Types
Here are four key ways Power BI helps organizations leverage diverse data types, driving smarter decisions and optimizing business performance across various
Power BI is adept at handling large quantities of customer information with varied fields, providing detailed analysis capabilities. Its ability to process and visualize big data enables organizations to derive actionable insights from extensive datasets, improving overall decision-making and operational efficiency. For large datasets, features like DirectQuery and aggregation techniques enhance performance while maintaining responsiveness.

Power BI facilitates the integration of sensor data, such as information captured through RFID tags and location data for logistics services. This integration allows businesses to monitor and visualize real-time inventory levels and asset utilization, which streamlines operations and improves supply chain efficiency. The visualizations created from this data help organizations optimize logistics and enhance product tracking.

The platform empowers businesses to analyze social data, including customer sentiment, feedback, and marketing campaign performance. Power BI's capabilities enable organizations to create custom dashboards that track engagement metrics and sentiment analysis, providing insights that inform marketing strategies and customer relationship management. This data-driven approach enhances brand loyalty and customer satisfaction through improved responsiveness.

Power BI also enables organizations to utilize public data from sources like data.gov, transforming this information into valuable insights. By connecting to various open data sources, businesses can analyze trends and drive strategic decisions based on external datasets. This capability enriches the context of internal data, allowing for comprehensive analysis and informed decision-making regarding market conditions and public sentiment.

Empower your Data with Meaningful Visualization through Power BI
Visualizations dramatically improve ability to grasp information hiding within your data. Access, evaluate, comprehend, and act on real-time data faster to identify new business opportunities ahead of the market. Visual data discovery ensures you find the data when you need it significantly increasing productivity.
Storify your data and open doors to new ways of looking at operational, sales or for that matter, any business data. With Power BI, Microsoft is making data and analytics truly accessible to all, by bringing it directly to the tools that you use every day. With both Excel and Power BI for Office 365, you can give everyone in your organization a powerful new way to work with and interpret data.
What is it that Power BI brings to businesses?
Power BI for Office 365 can easily deploy a cloud-based BI environment for users to share insights, collaborate and access reports, from anywhere. Everyone in your organization will have the power to look at data in a new way. Bringing these capabilities directly to the tools that people use every day, Power BI helps to create accessibility to analytics and discovery.
Data Source
Big Data
Large quantities of customer information with varied fields captured for detailed analysis
Sensor Data
Information captured through RFID tags, or location data for logistics services
Social Data
Customer sentiment, feedback and marketing campaign analysis
Public Data
Data published from data sources such as daga.gov initiatives to drive business insights
An energy enterprise leveraged Power BI for seamless CRM dashboard integration with MS Excel, enabling enhanced data visualization and decision-making. By addressing data type and relationship issues through advanced data modeling and Star Schema, we provided faster inferences from large, complex datasets. Explore how Power BI transformed their operations.
Read their success story

A cloud-based loan origination system streamlined its processes with complex Power BI dashboards, reducing overheads and enhancing decision-making speed. By integrating MS SQL Server and utilizing Power BI's data modeling, the solution offered quick insights with minimal intervention. Discover how Power BI transformed their operations.
Read their success storyBenefits of Data Visualization
Data visualization tools and techniques offer executives and other knowledge workers new approaches to dramatically improve their ability to grasp information hiding in their data. Here are the top 4 benefits that data visualization offers to decision makers and their organizations.

Power BI Services Tailored for Your Business
Transform your data into actionable insights with our comprehensive Microsoft Power BI Consulting Services, designed to streamline decision-making and optimize business performance.

Strategic Planning and Consultation
We assess your current data landscape, identify gaps, and develop a customized BI roadmap. As a Power BI consulting company, we ensure your data warehouse and tools are aligned to support your strategic goals and data-driven initiatives.

Custom Design and Visuals
We specialize in crafting visually appealing, user-friendly dashboards and reports. Our designs simplify complex data into clear, impactful visuals that drive better understanding across your organization.

Seamless Development and Implementation
Our Power BI implementation services process integrates seamlessly into your existing infrastructure, including advanced ETL/ELT processes and mobile-friendly solutions. We also offer deep integration with SQL tools like SSIS, SSRS, and more.

Holistic Integration Services
We connect Power BI with key business applications, from Dynamics 365 and Power Apps to Google Analytics and Excel, offering a unified view of your data for enhanced analysis and decision-making.

Comprehensive Testing and Support
Our rigorous quality assurance process ensures your Power BI solution is accurate, high-performing, and reliable. Plus, with our 24/7 Microsoft Power BI support, we’re always available to resolve any issues that arise.
Maximize your data’s potential
Contact our Power BI specialistWhy Nalashaa Digital
Nalashaa Digital stands as a trusted partner in driving digital transformation with deep expertise in Power BI consulting and Microsoft Dynamics Power BI integration. With a strong foothold across various industries, including healthcare, energy, and retail, we empower businesses to make data-driven decisions through tailored solutions. Our commitment to secure data management, intuitive dashboards, and actionable insights ensures that organizations maximize their potential in an increasingly digital landscape.
-
Expertise Across Verticals
Proven expertise across healthcare, energy, retail, and more.
-
Dynamics Power BI Integration
Seamless Microsoft Dynamics Power BI integration for real-time insights.
-
Tailored Power BI Dashboards
Custom Power BI dashboards for impactful, data-driven decisions.
-
Secure Cloud Data Solutions
Secure cloud-based data management and optimization.
Why Our Clients Love Us?
Want To Integrate Power BI
With Dynamics 365
Give us a call, start an online chat session, or send us a contact request your choice.
Worth Exploring
Frequently Asked Questions
Accessing the Power BI service can be accomplished through several straightforward methods:
Via a Link: If you receive an email containing a link to a Power BI dashboard or report, simply click the link to open it.
Through the Power BI Website: You can access Power BI by opening your web browser and navigating directly to app.powerbi.com.
Using the Office 365 Web App: Log into your Office 365 account. Then, click on the waffle icon (the app launcher), select "All apps," and choose Power BI from the list.
To create content in Power BI, a Power BI Pro or Premium Per User (PPU) license is required. You also have the option to sign up for a free 60-day trial of Power BI Premium Per User.
Once you are signed in to the Power BI service, you can:
View and Create Reports: You can either select an existing report or initiate the creation of a new one.
Connect to Other Services: Install apps to establish connections with various services and then view dashboards and reports directly within the app or Power BI service.
Share Reports and Dashboards: You can share your reports and dashboards with up to 100 users or groups simultaneously, or you can grant access to over 500 users by sharing multiple times or through user groups.
Grant Access to Others: You have the ability to give users read permissions for your reports or modify their permissions to allow them to reshare the content.
However, if you need expert guidance on best practices for data modeling, report creation, or data source integration, our professional Power BI consultants are here to help.
No, Power BI is not being discontinued. However, some components are being retired:
- -The Power BI Windows app was removed on December 31, 2023.
- -Power BI Premium Capacity licenses ended for new customers on -July 1, 2024, with renewals available until January 1, 2025.
- -Support for legacy Power BI apps ended in May 2024.
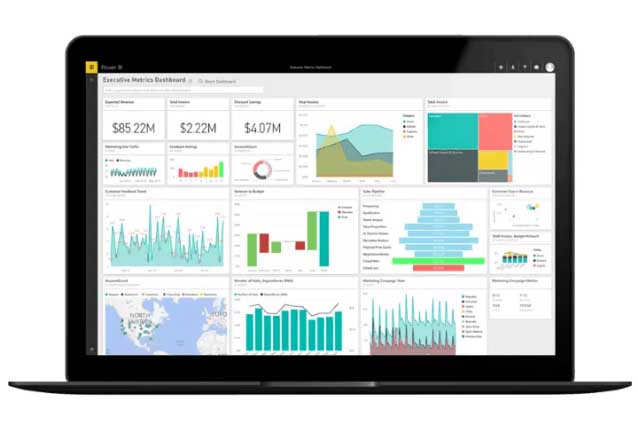
A Power BI dashboard is a single-page canvas that presents key visualizations or highlights a particular story using various charts and graphs. It is meant to provide a quick overview, allowing users to see important information at a glance. While a dashboard shows the most critical data, users can click on the visuals to access related reports for more detailed insights.
On the other hand, the Power BI Service is the online platform where users can create, view, and share dashboards and reports. Essentially, the dashboard is a specific feature within the Power BI Service, which encompasses a broader set of capabilities for data analysis and collaboration.
A Power BI dashboard is a single-page canvas that presents key visualizations or highlights a particular story using various charts and graphs. It is meant to provide a quick overview, allowing users to see important information at a glance. While a dashboard shows the most critical data, users can click on the visuals to access related reports for more detailed insights.
On the other hand, the Power BI Service is the online platform where users can create, view, and share dashboards and reports. Essentially, the dashboard is a specific feature within the Power BI Service, which encompasses a broader set of capabilities for data analysis and collaboration. In summary, think of the dashboard as a snapshot of data, while the Power BI Service is the overall environment where you manage your dashboards and reports.