Power BI Salesforce Integration Guide

Power BI Salesforce Integration Guide

Dec 16, 2025 Aiswarya Madhu

Well, this is what organizations are actually achieving when they get Salesforce and Power BI to work together. Enterprise teams that integrate both systems report returns as high as 299 percent within three years, and in some cases even 445 percent when the wider ecosystem includes platforms like MuleSoft. Yet most companies are still far from this reality. Only 28 percent of applications in a typical enterprise are truly connected, and 95 percent of businesses say integration challenges are slowing down their AI ambitions.

When Salesforce data finally flows into Power BI the way it should, the results are immediate. Project delivery speeds up by nearly 78 percent, sales forecast accuracy improves by up to 32 percent, and customer response times drop sharply as teams gain access to real time insights. Integrated teams also report higher CSAT scores and faster sales cycles, often shortening the path to revenue by 8 to 14 days.

In a CRM market racing toward 262 billion dollars, Power BI Salesforce Integration is no longer a technical upgrade. It has become a direct driver of ROI, operational clarity, and competitive advantage.

6 Reasons to Integrate Salesforce with Power BI

If you have worked with Salesforce long enough, you already know the reporting limitations. The platform is excellent for managing customer interactions, but when it comes to deep analytics or multi-system visibility, it can feel restrictive. That is usually the point where teams start exporting CSVs, building Excel workbooks, or stitching reports together manually. If any of this sounds familiar, integrating Salesforce with Power BI is what solves those day-to-day pain points.

Close Gaps in Salesforce Native Reporting

You might have noticed that Salesforce dashboards start to feel limiting once you want more than basic summaries. Things like complex cross-object joins, historical trend analysis, or advanced modeling are difficult to achieve in Salesforce. Power BI fills those gaps. It lets you combine multiple objects, create powerful DAX calculations, build richer visuals, and explore your data on a deeper level without wrestling with Salesforce’s constraints.

Consolidate Customer Journey Data

It is hard to get a complete customer picture if all your data lives in disconnected tools. You probably have customer information in Salesforce, financial data in your ERP, marketing data in another system, plus support activity captured elsewhere. Power BI brings all of this together. It pulls Salesforce data and blends it with every other source you depend on, so you finally get a true end-to-end view of your customer journey.

Real-Time, Data-Driven Decision Making

Most teams end up relying on stale reports because updating data manually takes too much time. If you have ever refreshed a dashboard only to realize it reflects last week’s pipeline, you know this problem well. Power BI lets you set up near real-time refreshes so your pipeline numbers, opportunity updates, and sales trends stay current. It helps leaders respond to issues faster instead of discovering them after the damage is done.

Improve Forecast Accuracy

Forecasting inside Salesforce works, but only to a point. If you want to test scenarios, compare historical patterns, or model different business outcomes, the built-in tools can feel restrictive. Power BI changes this completely. You get AI-powered visuals, what-if simulations, and DAX-based calculations that make forecasts more accurate and more flexible. This helps teams refine predictions and understand how different strategies could influence revenue.

Reduce Manual Work and Data Errors

If someone in your team still exports CSV files to build weekly or monthly reports, they are doing extra work that Power BI can automate. Manual exports increase the chance of errors and slow down reporting cycles. Integrating Salesforce directly with Power BI removes that effort entirely. Data moves automatically, stays consistent, and gives you a clean foundation to build trustworthy insights.

Boost Team Productivity

Switching between systems just to piece together numbers waste time. Power BI keeps everything in one place so sales reps, managers, and executives can access the insights they need without juggling tools. Instead of gathering data, your teams can focus on interpreting it, planning next steps, and acting on what the numbers really say.

Check out this guide to understand the full process and best practices for Dynamics 365 Power BI integration.

Power BI Salesforce Integration Use Cases Across Teams

Here’s how your team can bring Power BI Salesforce integration into everyday work:

Power BI Integration Benefits

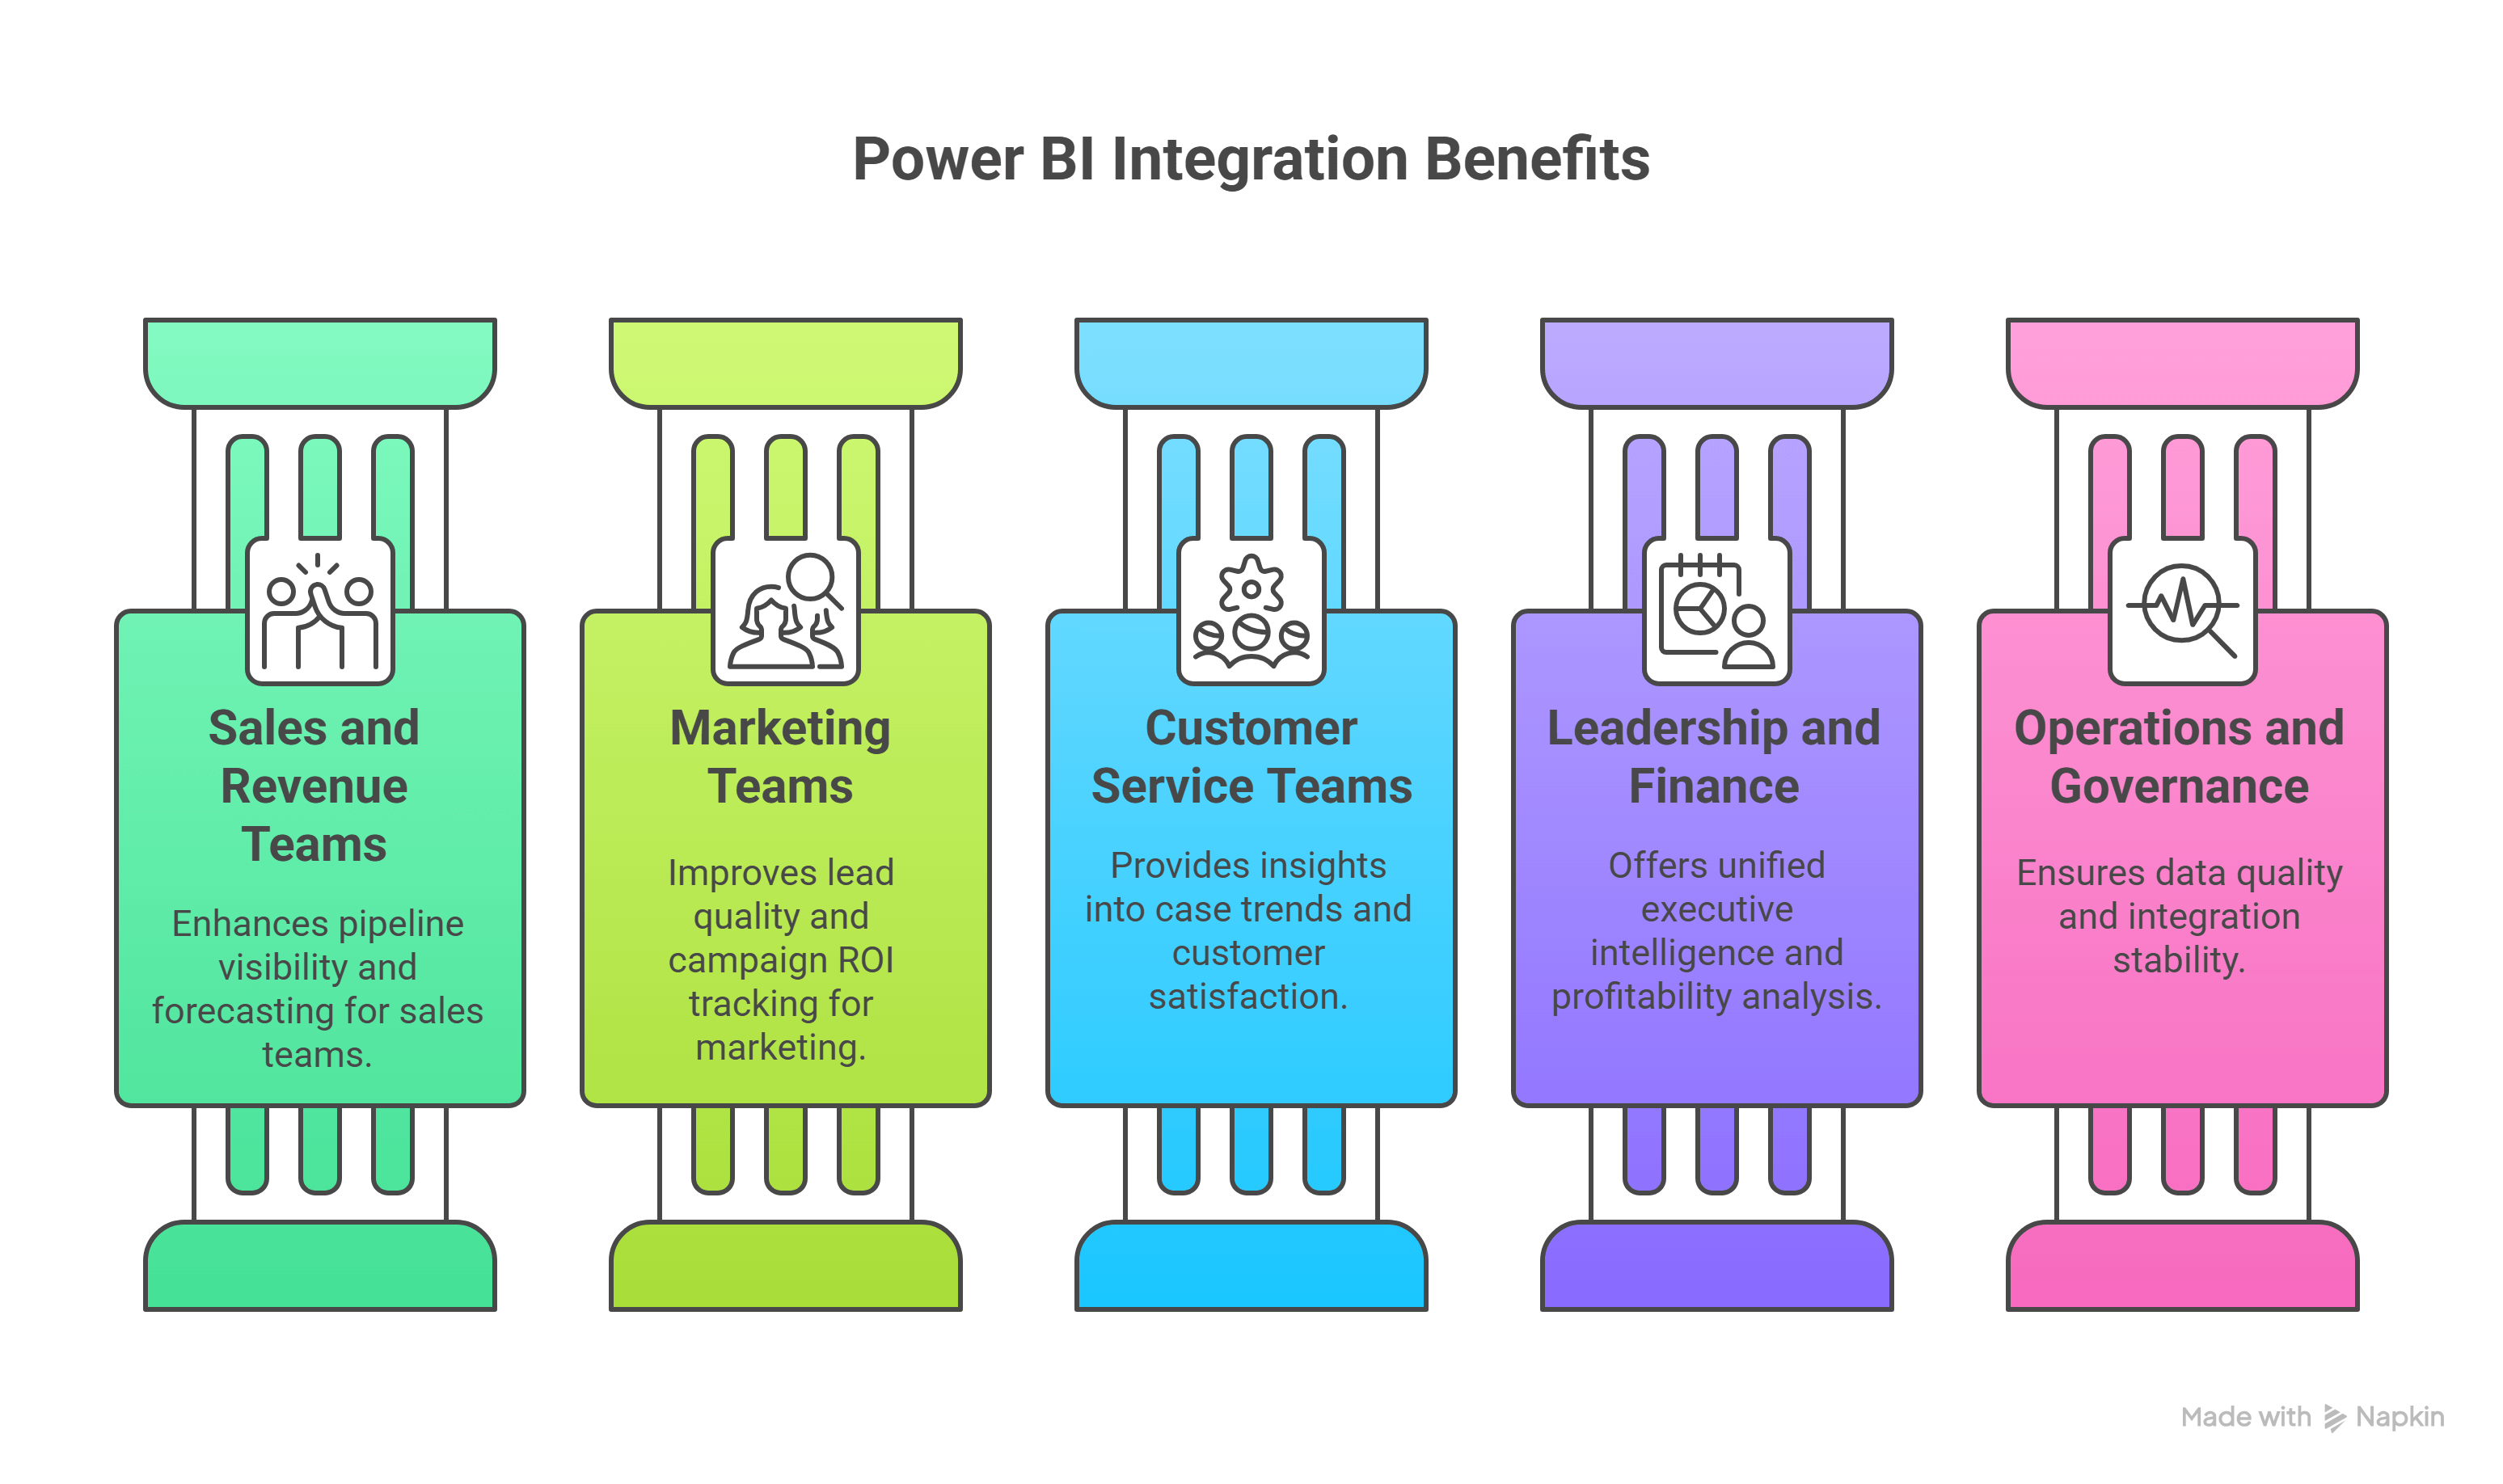
Sales and Revenue Teams

  • Strong Pipeline visibility: Visual stage-by-stage breakdown of deals to spot bottlenecks.
  • Strong Conversion funnel performance: Highlights where leads drop off and why.
  • Strong Opportunity forecasting: Uses AI and historical data to improve close probability insight.
  • Strong Territory performance: Dashboards by region, team, or rep instead of spreadsheets.
  • Strong Quota attainment tracking: Real-time visibility into progress and gaps.

Marketing Teams

  • Strong Lead quality and source performance: Connects campaigns to actual lead outcomes.
  • Strong Campaign ROI by source and segment: Tracks impact by channel and audience.
  • Strong Lead-to-opportunity performance: Measures handoff effectiveness to refine targeting.
  • Strong Multi-channel attribution: Combines data sources for full touchpoint visibility.

Customer Service Teams

  • Strong Case trends: Detects recurring issues and predicts case volume spikes.
  • Strong SLA adherence: Tracks real-time compliance with service commitments.
  • Strong Time to first response: Identifies delays in initial customer engagement.
  • Strong Customer satisfaction analysis: Combines CSAT and case data to find improvement areas.

Leadership and Finance

  • Strong Revenue trends vs forecast: Track actuals, forecast variances, and insights.
  • Strong Churn predictions: Detect churn signals from usage, service, and sales data.
  • Strong Multi-department KPIs: Unified KPI dashboard for marketing, finance, and sales.
  • Strong Profitability analysis using Salesforce plus ERP: Understand profit at deal or customer level.

Operations and Governance

  • Strong API consumption monitoring: Stay ahead of API limits and usage spikes.
  • Strong Data quality issues: Find inconsistencies, gaps, or duplicates in data.
  • Strong Integration bottlenecks: Visualize delays and flow issues across systems.
Check out this blog to learn the top reasons Power BI outperforms Excel for analytics and reporting.

Power BI Salesforce Integration Methods

Every business connects Salesforce and Power BI for different reasons. Some teams want a simple plug and play connector, while others need enterprise-grade automation. This section walks you through each integration method in a practical, no-nonsense way so you can decide which approach fits your Salesforce environment.

Method 1: Native Power BI Salesforce Objects Connector

How it works?
You sign in using your Salesforce credentials inside Power BI and choose the objects you want to import. Power BI then pulls the raw tables for modeling and visualization.

Where teams struggle?
If you have a heavily customized Salesforce org or you rely on objects with long relational chains, this connector can get messy. Nested objects, lookups, and custom fields often need cleanup inside Power Query before they start making sense. And since this connector depends on Salesforce APIs, running too many queries can quickly eat into your daily API limit.

Who this is best for?
If your dataset is small or moderately sized and you just want quick analysis without writing code, this method is perfect. It is also the closest match to the Merlin AI tutorial flow you referenced.

When to avoid it?
If your Salesforce data structure is large, heavily nested, or contains millions of rows, this method will slow down quickly.

Pros

  • Easy to set up
  • Great for quick exploration
  • Zero development needed

Cons

  • Subject to Salesforce API limits
  • Can struggle with complex joins
  • Less suited for large or relational datasets
  • Limited transformation capacity

Method 2: Native Power BI Salesforce Reports Connector

Where it shines?
It is fast, simple, and ideal for users who want to build dashboards without worrying about relationships or data modeling. What you see in the Salesforce report is exactly what Power BI imports.

Where it falls short?
There is a strict 2,000 row limit per report. If your team relies on detailed or high-volume reporting, you will outgrow this method almost immediately. Since you cannot restructure the data, you are also locked into whatever the original Salesforce report provides.

Pros

  • Very easy to use
  • No data modeling required
  • Great for light dashboards

Cons

  • 2,000 row limit
  • No complex modeling
  • Fully dependent on Salesforce report setup

Method 3: Salesforce Data Loader (Manual or Scheduled)

How teams use it
You export the data you need, load it into Power BI, clean the CSV, and refresh dashboards manually or through scheduled scripts.

Where you feel the pain?
The data is only as fresh as your last export, which makes it a batch-style approach. CSV files also tend to need cleanup before they behave well in Power BI.

Best for
Teams that do weekly or monthly reporting and prefer a controlled, offline flow.

Pros

  • Works well for large bulk exports
  • Full control over data handling
  • Useful in secure or offline environments

Cons

  • Not real time
  • Requires manual prep unless automated
  • Extra data cleansing required
  • Higher chance of outdated data

Method 4: Salesforce APIs (REST, SOAP, Bulk 2.0)

How it works?
Your developers connect to Salesforce using REST, SOAP, or Bulk API and push data into SQL Server, PostgreSQL, Snowflake, or another warehouse. Power BI then reads from that database.

Where teams feel the benefit
You bypass most native limitations. You automate everything. You can handle millions of rows with clean transformations before the data reaches Power BI.

But it is not for everyone
This method requires coding, authentication logic, monitoring, and periodic maintenance.

Pros

  • Maximum control
  • Handles very large datasets
  • Ideal for custom pipelines
  • Supports full automation

Cons

  • Requires developer skills
  • Needs monitoring and maintenance
  • More setup time

Method 5: Power BI Dataflows

Why teams like it?
Dataflows allow reusable queries, shared transformations, incremental refresh, and consistent data prep across multiple reports.

Where the limitations show up?
Since they still use the native Salesforce connector, your API limits remain a bottleneck. They also struggle with extremely large or complex datasets.

Pros

  • Reusable ETL logic
  • Centralized governance
  • Incremental refresh
  • Cleaner data prep

Cons

  • Still subject to API limits
  • Can become slow for big datasets
  • Requires Premium for some features

Method 6: ETL or ELT Pipelines to a Data Warehouse or Lakehouse

Why enterprises choose this?
It supports historical modeling, multi-system joins, high-volume analytics, and advanced transformations. You can store years of Salesforce data and analyze it without performance issues.

The trade-offs
This approach needs data engineering skills and budget for cloud infrastructure.

Pros

  • Highly scalable
  • Ideal for cross-system analytics
  • Supports complex transformations
  • Handles very large datasets

Cons

  • Higher cost
  • Longer setup time
  • Requires data engineering expertise

Method 7: Skyvia Connect (OData Live Connection)

Why teams use it?
It gives you real-time analytics without coding. You can limit which tables and fields are exposed, making it simple to enforce security policies.

Where to be cautious?
OData performance can slow down if your queries get complex or your dataset becomes large.

Pros

  • No-code setup
  • Real-time dashboards
  • Strong governance options
  • Easy to secure

Cons

  • Performance depends on query complexity
  • Network-dependent
  • Not ideal for very large datasets

Method 8: Skyvia Replication (No-Code ETL to a Database)

Why it works well?
This method handles very large datasets, supports multiple sources, and automates refresh without any coding. It is one of the simplest ways to build multi-system analytics without hiring developers.

The only limitation
The data is near real time, not fully live, because it depends on the sync schedule.

Pros

  • No coding required
  • Handles large volumes
  • Easy scheduling
  • Perfect for enterprise analytics

Cons

  • Data is only as fresh as the last sync
  • Needs initial setup
  • Some features require paid plans

Method 9: Embedding Power BI Inside Salesforce

How it works?
You embed Power BI reports using a Lightning component or iframe. Users can interact with their dashboards without leaving Salesforce.

Important to note
This method does not move data between systems. It only brings your existing Power BI analytics into the CRM. You still need a pipeline behind the scenes.

Pros

  • Analytics inside Salesforce workflow
  • Improves adoption
  • Provides context-aware insights

Cons

  • Requires Power BI Pro or Premium
  • Limited drillthrough features
  • Not a true integration or pipeline

Salesforce Power BI Integration Best Practices

Filter smarter before you fetch

Use SOQL filters to request only the records and fields you actually need. This keeps your API usage under control and prevents unnecessary load on your connector.

Do your heavy lifting before the data reaches Power BI

Transforming raw Salesforce data inside Power BI slows everything down. Push that work to Dataflows or an ETL tool so Power BI receives clean, structured data that is ready for modeling.

Structure your model like a star

A clean semantic model with fact tables and dimension tables makes a huge difference. It simplifies relationships, speeds up queries, and keeps reports from breaking when your dataset grows.

Refresh only what changes

Full data refreshes are expensive. Using incremental refresh tells Power BI to update only new or modified data. This is essential when you are working with large historical tables.

Keep DAX lightweight

Complex calculations inside visuals slow dashboards instantly. Build your logic as measures and calculated columns instead. Your reports will render faster, and your model will be easier to manage.

Watch your refresh history

Refresh failures often happen quietly, leaving users with stale numbers. Set alerts and check refresh logs so issues are fixed before anyone relies on outdated data.

Read this guide to explore Microsoft Power BI features, implementation tips, and answers to common FAQs.

Data Security and Compliance Essentials for Power BI Salesforce Integration

Use role-based access everywhere

Limit sensitive fields and dashboards to the people who truly need them. This applies across both Salesforce and Power BI.

Label your data so people know how to treat it

Power BI allows you to classify datasets as public, internal, or confidential. This keeps compliance teams happy and helps users understand what they are handling.

Make sure everything is encrypted

Salesforce already encrypts data, but ensure Power BI and Azure storage follow the same standard. This is critical if you handle personal or financial data.

Monitor API usage before it becomes a problem

API limits can break refreshes without warning. Regular monitoring helps you catch spikes or misuse early.

Keep a record of changes

Audit logs for refreshes, model updates, and published reports help you stay compliant and make troubleshooting easier when something goes wrong.

Conclusion

So, you may have already decided on the right methods for your Power BI Salesforce integration. That is a strong first step. But it is just as important to stay aware of the problems that quietly derail most projects. From unclear scope and incorrect data mapping to API limits, poor modeling, and post-go-live neglect, these issues can undo even the smartest integration plan.

This is where the right Power BI consulting service provider makes a difference. A good partner helps you avoid these pitfalls, sets up a clean data foundation, builds the right models, and ensures the integration stays reliable long after it goes live. Getting the method right matters, but getting the execution right is what matters most.

About Author

Never Miss News

Want to implement Dynamics 365?


We have plans which will meet your needs, and if not we can tweak them around a bit too!

Field will not be visible to web visitor