Dynamics 365 Reports and Dashboards: A Comprehensive Guide to Customization
Mar 11, 2019 Aiswarya Madhu
Editor’s Note
Exploring the potential of Dynamics 365 Reports and Dashboards reveals how these tools can truly transform business operations. This blog is all about helping you harness that power. We dive deep into how customizable Reports and Dashboards can be game changers for your business, turning complex data into clear, actionable information. started.
When it comes to maximizing the potential of Microsoft Dynamics 365, customization is key. Among the most powerful tools within the platform are Dynamics 365 Reports and Dashboards, which serve as vital components for data visualization and decision-making. These tools transform vast amounts of business data into concise, actionable insights, allowing organizations to monitor performance, identify trends, and make informed decisions with ease. Whether you're customizing dashboards to track sales, monitor customer service metrics, or manage financial data, Dynamics 365 provides the flexibility to tailor these visual elements to meet the specific needs of your business. As you delve into customizing your Dynamics 365 environment, understanding the capabilities and best practices for Dynamics 365 Reports and Dashboards will be crucial in driving your business forward.
On this Page
Types of Dashboards in Dynamics 365
Single Stream Dashboards:
Single stream dashboards focus on displaying a single set of data points, typically in the form of one chart or graph. This simplicity makes them ideal for users who need to monitor large amounts of data concisely, such as daily sales figures or monthly revenue.
Unified Interface Dashboards (Multi-Stream Dashboards):
Also known as multi-stream dashboards, these consist of multiple charts or graphs organized into sections on a single page. They are perfect for users who need to track various aspects of their business simultaneously, such as sales performance by region or customer satisfaction across different product lines.
Interactive Experience Dashboards:
Interactive experience dashboards allow users to engage directly with the data. Featuring advanced elements like global filters, visual filters, and tiles, these dashboards enable users to customize their view according to their specific needs, offering a more tailored approach to data interaction.
Types of Reports in Dynamics 365
Standard Reports:
These pre-built reports come out-of-the-box with Dynamics 365 and cover common business needs such as sales performance and customer service metrics. While useful for quick insights, they may require customization to meet specific business requirements.
Custom Reports:
Tailored to the specific needs of a business, custom reports can combine multiple data sources, apply complex filters, and present data in formats that meet unique organizational requirements. These are particularly valuable in industries with specialized reporting needs.
Excel-Based Reports:
Dynamics 365 allows users to export data directly into Excel spreadsheets, ideal for creating ad-hoc reports and performing detailed analysis. This method is particularly useful for sharing data with users who may not have direct access to Dynamics 365.
Power BI Reports:
The most advanced reporting option in Dynamics 365, Power BI reports integrate multiple data sources, offer complex visualizations, and enable real-time data analysis. Power BI is especially valuable for organizations requiring comprehensive business intelligence solutions.
Here's what people think about Dynamics 365 Reports and Dashboards:

Read More: Explore the key differences between customization and configuration in Dynamics 365. Read the blog to know more about how each approach can impact your business processes.
Step-by-Step Guide to Creating Effective Dashboards and Reports
Here are some of the most effective strategies for creating impactful Dynamics 365 Reports and Dashboards. These steps will help you design and customize visualizations that provide clear insights and drive better business decisions.
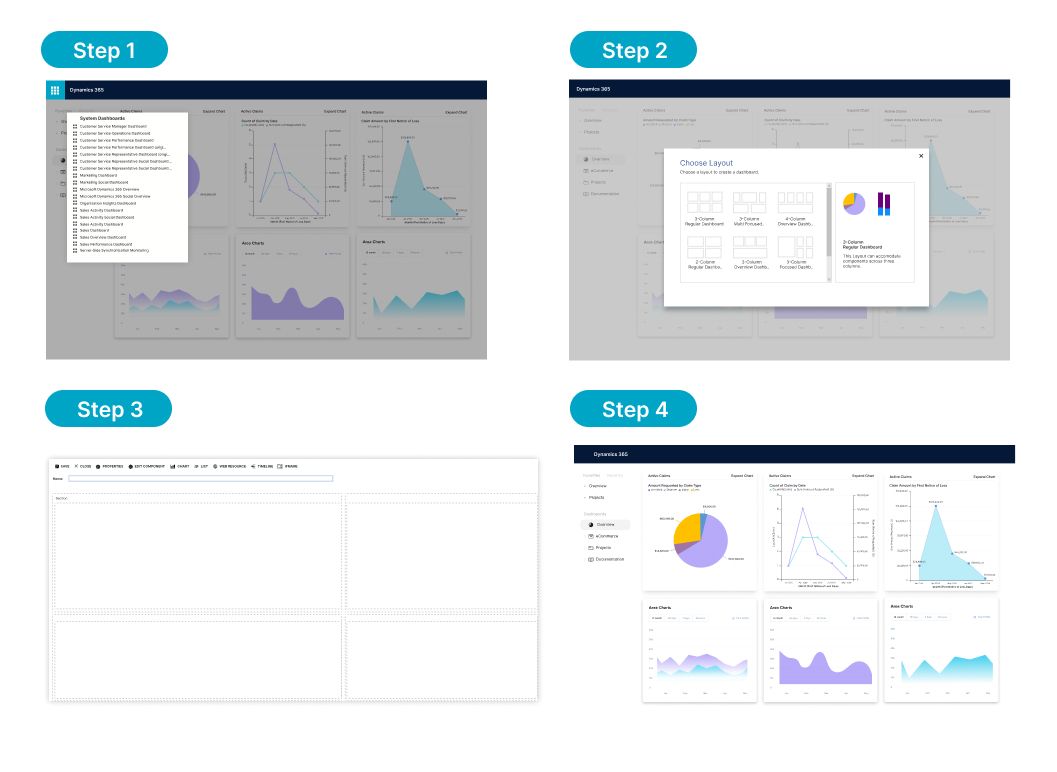
Step 1: Strategic Dashboard Design
The first step in creating an effective dashboard is understanding the specific needs of your business and the data that will drive decisions. This involves:
Defining Key Metrics:
Identify the metrics that are crucial to your role or department. For example, a sales manager might focus on pipeline health, while a customer service manager might track case resolution times.
Visual Layout Planning:
Consider how these metrics should be displayed. Should key performance indicators (KPIs) be front and center? Would a side-by-side comparison of current and previous quarters enhance your insights? A well-thought-out design makes the dashboard not just informative, but also intuitive.
Step 2: Creating Tailored Views
Views in Dynamics 365 are essentially customized lists of records filtered based on specific criteria. To create a view that provides meaningful insights:
Use Filters Wisely:
Apply filters that narrow down data to what’s most relevant. For instance, a manufacturing manager might filter for production line efficiency metrics, while a healthcare provider might filter patient data by treatment type and outcomes.
Advanced Find:
Utilize the Advanced Find feature to create highly specific views. This allows users to drill down into data, ensuring that the view reflects exactly what they need, such as sales leads from a particular region or unresolved service cases within a critical timeframe.
Step 3: Building Dynamic Charts
Charts transform data into visual formats that are easier to digest at a glance. Dynamics 365 offers a range of chart types, including bar, pie, and line charts:
Chart Customization:
Customize charts to reflect the most critical data points. For example, in the financial sector, a bar chart could display quarterly revenue across regions, while in customer service, a pie chart could show the distribution of case types.
Interactive Elements:
Dynamics 365 charts are interactive, allowing users to click on specific data points to see underlying details. This interactivity is crucial for roles that require quick decision-making based on real-time data.
Step 4: Assembling a Comprehensive Dashboard
Once you have your views and charts, it’s time to bring everything together in a cohesive dashboard:
Component Integration:
Dynamics 365 allows the integration of multiple components, including views, charts, web resources, and iFrames. This flexibility means you can create a dashboard that not only shows raw data but also includes additional resources, such as real-time updates from external systems.
Layout Optimization:
Choose from various layout options to ensure that the dashboard is easy to navigate. You might opt for a layout that places KPIs at the top, with supporting data in lower sections for quick reference.
Recommended Reading: Discover the top 8 Microsoft Dynamics Customizations that go beyond the basics to elevate your CRM experience. Read the blog to know more about how these customizations can transform your business.
Advanced Reporting Techniques in Dynamics 365
While dashboards provide real-time insights, reports offer the depth of analysis needed for strategic planning. Dynamics 365’s reporting capabilities can be expanded with tools like Excel and Power BI:
Excel Integration for Detailed Analysis
Excel remains a powerful tool for in-depth data analysis:
Dynamic Worksheets:
Export data to Excel as a dynamic worksheet, which remains linked to Dynamics 365. This allows real-time updates in your Excel sheet, making it easier to analyze trends as they evolve.
Advanced Excel Functions:
Use Excel’s advanced functions, such as pivot tables, to manipulate data further. This is particularly useful in industries like finance, where granular data analysis is often required.
Power BI for Cross-Platform Insights
When your data needs go beyond what’s available in Dynamics 365, Power BI steps in:
Complex Visualizations:
Power BI supports sophisticated visualizations, such as heat maps and scatter plots, that are essential for industries like healthcare, where understanding complex patterns in patient data is critical.
Data Integration:
Power BI allows for the integration of data from multiple sources, providing a holistic view that’s vital for strategic decision-making in industries like manufacturing, where supply chain data from various vendors needs to be consolidated.
Industry-Specific Applications of Dynamics 365 Dashboards and Reports
Healthcare
In healthcare, Dynamics 365 dashboards are essential for monitoring patient flow, treatment outcomes, and resource utilization.
Patient Management Visuals
Real-time insights into patient status, appointment schedules, and treatment plans can be integrated from EHR systems and other patient management tools. This provides healthcare providers with a comprehensive view of patient interactions, helping optimize resource allocation.
Outcome Analysis and Reporting
Track treatment outcomes across different patient demographics to identify trends and areas for improvement, such as recovery rates or patient satisfaction.
Resource Utilization
Monitor the use of staff, medical equipment, and facilities to ensure efficient resource use, helping to identify and address bottlenecks.
Customization Tip: Integrate Dynamics 365 with Power BI to create advanced visualizations and predictive analytics, enabling deeper analysis of patient data and real-time monitoring of resources.
Manufacturing
Manufacturing dashboards focus on optimizing production efficiency, supply chain management, and quality control.
Production Efficiency Dashboards
Display real-time data on production line performance to identify bottlenecks and adjust workflows, maintaining optimal efficiency.
Supply Chain Analysis Reports
Analyze supplier performance to ensure timely and quality deliveries, reducing production delays.
Quality Control Monitoring
Track defect rates and other quality metrics to maintain high production standards.
Customization Tip: Integrate IoT sensors with Dynamics 365 to provide real-time machine data, enabling predictive maintenance and reducing downtime.
Finance
In finance, Dynamics 365 dashboards and reports are critical for managing financial performance, investments, and risk.
Investment Tracking Dashboards
Consolidate data from various investment portfolios to provide a real-time view of performance across assets.
Risk Management Reports
Assess risk exposure across different investments, enabling informed decisions about portfolio adjustments.
Cash Flow Analysis
Monitor cash flow in real-time to manage liquidity and ensure financial stability.
Customization Tip: Use Dynamics 365 with Power BI to create interactive dashboards that allow users to drill down into specific investment details, cash flow trends, and risk exposure.
Sales and Marketing
Sales and marketing teams utilize Dynamics 365 dashboards to optimize lead generation, conversion rates, and campaign effectiveness.
Lead Conversion Dashboards
Monitor the progress of leads through the sales funnel, identifying stages that need additional focus to improve conversion rates.
Campaign Performance Reports
Analyze the effectiveness of different marketing campaigns, optimizing strategies based on engagement and ROI.
Customer Segmentation Analysis
Create detailed reports on customer segments to tailor marketing efforts more effectively.
Customization Tip: Implement AI-driven insights within Dynamics 365 to predict lead conversion likelihood and optimize marketing campaigns for higher engagement.
Customer Service
Customer service departments rely on dashboards to manage case resolution times, customer satisfaction, and service level agreements (SLAs).
Case Management Dashboards
Display the status of open cases, helping service representatives prioritize work based on urgency and customer impact.
Customer Feedback Reports
Analyze customer feedback to identify areas for service improvement, enhancing overall satisfaction.
SLA Compliance Monitoring
Track SLA performance to ensure commitments are met, reducing the risk of penalties and improving customer trust.
Customization Tip: Automate case escalation and SLA breach alerts within Dynamics 365 to ensure timely resolution and maintain high levels of customer satisfaction.
Best Practices for Maximizing Dynamics 365 Reports and Dashboards
Optimizing Dynamics 365 dashboards and reports is essential for transforming raw data into actionable insights that drive business success. Here are some best practices to help you get the most out of your Dynamics 365 dashboards and reports:
Identify Key Metrics
Start by identifying the key metrics that matter most to your business. Focus on the data that directly impacts your strategic goals, such as sales performance, customer satisfaction, or operational efficiency. This ensures that your dashboards and reports are centered around the most critical information. Use Dynamics 365’s advanced filtering options to create custom views that focus on these key metrics. This allows you to highlight the most relevant data, ensuring that it’s always front and center on your dashboard.
Choose the Right Visualization Tools
Selecting the appropriate visualization tools is vital for making your data easy to understand. Dynamics 365 offers various options like charts, graphs, and tables, which can be customized to reflect your business needs. For more advanced visualizations, integrating Power BI with Dynamics 365 allows you to create interactive dashboards that provide deeper insights. When integrating Power BI, consider leveraging its drill-down capabilities, allowing users to explore underlying data points directly from the dashboard, facilitating more detailed analysis without overwhelming the initial view.
Use Color and Contrast Effectively
The effective use of color and contrast can help highlight important data points, making it easier to identify trends and outliers. By applying consistent color schemes, you can create a visual hierarchy that guides users through the most critical information without overwhelming them. Establishing a standardized color palette that aligns with your company’s branding and using it consistently across all dashboards and reports not only enhances visual appeal but also reinforces brand identity.
Customize Layouts for Usability
A well-organized layout is key to making your dashboard intuitive and user-friendly. Group related data points together and use whitespace to create a clean, uncluttered interface. This not only enhances the user experience but also ensures that the most important data is always front and center. Experiment with different layouts by dragging and dropping components in the dashboard editor until you find a configuration that maximizes efficiency for your team’s workflow.
Incorporate Interactive Elements
Incorporating interactive elements like drill-down capabilities enables users to explore data in greater detail without cluttering the dashboard. This makes the dashboards more dynamic and useful for in-depth analysis, allowing users to uncover insights that might otherwise go unnoticed. Integrating interactive charts that allow users to click on specific data points and view more detailed reports or related metrics enhances the depth of analysis while keeping the main dashboard streamlined.
Conclusion
While Dynamics 365 offers powerful tools for customizing dashboards and reports, organizations often encounter complexities that require expert assistance. Without consulting support, businesses may miss out on identifying the right metrics, designing effective visualizations, integrating advanced features, and ensuring compliance. Leveraging consulting services ensures that your Dynamics 365 implementation is not only efficient but also aligned with your evolving business needs.
FAQ
- Get the Report URL: Navigate to the Reports section in Dynamics 365. Select the report you want to add, then copy the report's URL. Open the URL in Notepad and modify the string "action=filter" to "run" to ensure the report runs automatically when the dashboard loads.
- Access the Dashboard Settings: Click the gear icon in Dynamics 365, then go to Advanced Settings. Navigate to Settings > Customizations > Customize the System > Dashboards. Choose an existing dashboard to modify or create a new one.
- Add an iFrame Component: In the dashboard editor, add an iFrame component to the desired location on the dashboard.
- Paste the Report URL: Paste the edited report URL into the iFrame’s URL field. Make sure to uncheck the box labeled Restrict cross-frame scripting to allow the report to display correctly.
- Save and Publish the Dashboard: Save your changes to the dashboard. Publish the dashboard within the editor. Navigate back to the Solution and publish it again to finalize the changes.
- Creating a New System Dashboard: Open Solution Explorer in Dynamics 365. Navigate to Components > Dashboards. Select New to create a new dashboard, choose a layout, name the dashboard, and add components like charts or lists. Save and publish.
- Editing an Existing Dashboard: Open Solution Explorer and select the dashboard to edit. Modify component properties, save, and publish changes.
- Additional Customization Options: Add or remove components, set a default dashboard, or control visibility using security roles.
Recent Posts

Proven Methods to Reduce Business Central Upgrade Time by 40%
Mar 19, 2026

Prepare for Business Central Release Waves [Here's What to Fix Before You Upgrade]
Mar 19, 2026

The Business Central Shift in Recent Release Waves Customers Cannot Afford to Ignore
Mar 19, 2026
Category
Our Expertise


About Author

Aiswarya Madhu
Aiswarya Madhu is an experienced content writer with extensive expertise in Microsoft Dynamics 365 and related Microsoft technologies. With over four years of experience in the technology domain, she has developed a deep understanding of Dynamics 365 applications, licensing, integrations, and their role in driving digital transformation for organizations across industries.
Never Miss News
Want to implement Dynamics 365?
We have plans which will meet your needs, and if not we can tweak them around a bit too!