Tableau to Power BI Migration: A Practical Guide
Sep 09, 2026 Aiswarya Madhu
Tableau to Power BI migration is rarely a linear move from one platform to another. It is a series of decisions around what to keep, what to rebuild, what to rethink, and how to move without losing trust in the data.
We have worked with organizations that came to the migration decision for very different reasons.
- Some were looking at licensing costs.
- Others were trying to simplify an analytics environment that had grown difficult to manage.
- In several cases, the biggest challenge was not moving the dashboards at all. It was making sure users continued to trust the numbers once those dashboards were rebuilt in Power BI.
Here are a few examples of what those situations looked like.
In One Case, a Healthcare Organization Had 200 Reports to Prioritize
One healthcare organization was working with more than 200 Tableau reports and wanted to move toward Power BI as part of a broader Microsoft environment.
The immediate challenge was not simply recreating every report. The team first had to understand which dashboards were still important, which ones users depended on regularly, and which could be left behind.
So the migration started with a smaller set of reports rather than the entire estate at once. Those reports were rebuilt and tested first, giving the team a chance to validate the data, understand how existing Tableau logic translated into Power BI, and see how users responded to the new experience.
That phased approach also made adoption easier. Instead of asking everyone to switch platforms at the same time, users were introduced to Power BI gradually and given time to understand how their familiar reports worked in the new environment.
The result was a simpler reporting setup that fit more naturally into the organization's existing Microsoft ecosystem, while also reducing unnecessary licensing overhead.
In Another, a Merger Left a Cybersecurity Company With Two Environments
Another migration started after a cybersecurity company went through a merger. The organization was left with reporting spread across different systems, and Tableau had become one more layer in an already complicated analytics environment. More than 80 reports needed to be considered, but the company could not afford to disrupt the reporting people were using every day.
The work therefore had to be sequenced carefully. Business-critical reports moved first, data was repeatedly checked between the old and new environments, and users were trained alongside the migration instead of only after everything had been completed.
That mattered because the technical migration was only part of the problem. The team also needed confidence that moving to Power BI would not make reporting slower or harder.
After the migration, the organization reported a 20% reduction in BI-related costs, reports were produced around 30% faster, and data movement improved significantly.
The important lesson from this project was that migration order matters. Moving the reports with the greatest business value first gave users an immediate reason to engage with Power BI, while less important reports could follow later.
In a Third, Reports Were Rethought Rather Than Rebuilt
We have also seen healthcare organizations consider Power BI because they wanted to get more out of an existing Microsoft technology stack.
In one such case, the migration was less about replacing Tableau for the sake of replacing it and more about simplifying the way analytics connected with the systems employees were already using.
Each report was reviewed before it moved. The team identified which dashboards were genuinely useful, migrated them in stages, and collected feedback throughout the process.
That feedback changed some of the Power BI dashboards along the way. Rather than trying to reproduce Tableau screen for screen, the team used the migration as an opportunity to improve how people interacted with the information.
The result was lower licensing overhead, tighter integration with the organization's existing tools, and a reporting environment that made it easier for users to find the information they needed.
What These Projects Have in Common
The organizations were different, but the migration challenges were surprisingly similar.
None of them benefited from treating Tableau to Power BI as a simple report conversion exercise.
They had to decide
- What was actually worth migrating
- Validate calculations carefully
- Introduce Power BI without disrupting day-to-day reporting, and give users enough time to build confidence in the new platform.
That is why the best migrations do not start by asking, "How do we move every Tableau report?"
They start by identifying which reports are actually worth carrying forward, how they work today, and what users still need from them in Power BI.
Once that is clear, the rest of the migration becomes much easier to plan.
Planning a Tableau to Power BI migration?
Why Are Teams Considering Power BI?
Cost is often the first reason Power BI enters the conversation.
As of August 2026,
- Power BI Pro is listed at $14 per user per month.
- Tableau Cloud Standard is priced at $75 per month for Creators, $42 for Explorers, and $15 for Viewers, based on published pricing from Microsoft and Tableau.
For an organization with hundreds or thousands of BI users, that difference quickly becomes difficult to ignore.
There are also broader ecosystem considerations.
- Organizations already using Microsoft 365, Azure, Entra ID, Fabric, and other Microsoft services may find that Power BI fits more naturally into an environment they already manage.
- AI is another factor. Power BI users working with qualifying Microsoft Fabric capacity can access Copilot capabilities without introducing a separate analytics platform.
- Development and deployment practices have evolved as well. Microsoft Fabric supports Git integration with GitHub and Azure DevOps, which can make version control and deployment more familiar to engineering teams.
What a Tableau to Power BI Migration Actually Looks Like
For a mid-sized environment with roughly 50 to 100 active workbooks and 300 to 500 users, six to eight months is a reasonable planning range. Smaller estates with straightforward reporting may move faster, while environments with complex LOD expressions, blended data, advanced security, or large numbers of reports can take considerably longer.
The exact timeline will vary, but the migration itself usually follows a sequence like this.
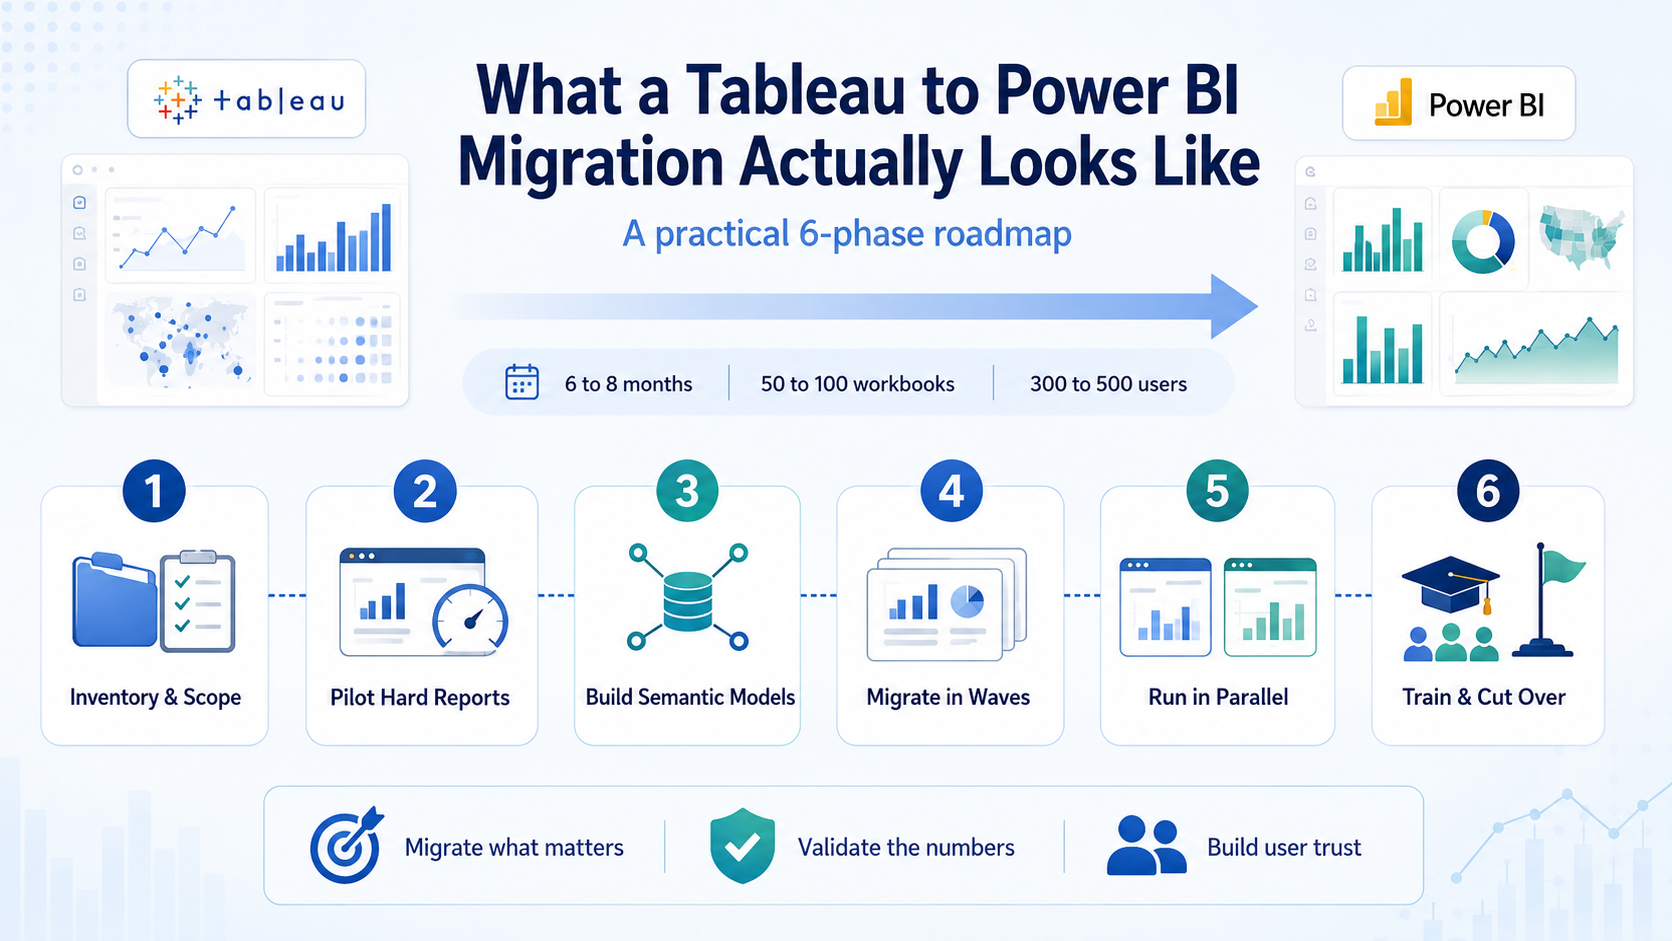
Phase 1: Inventory and Scope the Tableau Estate
Weeks 1 to 2
Before deciding how to migrate, understand what is actually running in Tableau.
Review each workbook for:
- Ownership and recent usage
- Data sources and dependencies
- Calculated fields
- Security requirements
- LOD expressions and table calculations
- Parameters, actions, and data blends
This exercise usually reveals that not everything needs to move.
Some reports may no longer be used. Others may be near-duplicates that can be consolidated into a single Power BI report. The remaining workbooks can then be grouped by complexity and business importance.
This is also the right time to model licensing based on:
- Creators and report authors
- Editors and analysts
- Read-only users
- Per-user Power BI licensing versus Fabric capacity
By the end of this phase, you should have a defined migration scope rather than simply a count of Tableau workbooks.
Phase 2: Pilot the Reports Most Likely to Cause Problems
Weeks 3 to 6
The pilot should test the difficult parts of the migration, not simply prove that Power BI can recreate a basic dashboard.
Select three to five workbooks that represent the real complexity of your Tableau environment, such as:
- Nested LOD expressions
- Table calculations
- Blended data sources
- Row-level security
- Complex filters and interactions
- Large datasets or performance-sensitive reports
Rebuild those reports in Power BI and compare them directly with Tableau.
The pilot should confirm that:
- Key numbers reconcile correctly
- Filters behave as expected
- Security restricts the right users
- Refresh schedules run reliably
- Performance holds up with production-sized data
This is also where you begin establishing the DAX patterns and semantic model conventions that will be reused throughout the rest of the migration.
Track how long each pilot workbook actually takes to rebuild and validate. That gives you a much more realistic estimate for the wider migration than simply multiplying an assumed number of hours by the total workbook count.
Phase 3: Build the Shared Semantic Models
Weeks 7 to 12
Once the pilot confirms the migration approach, the focus shifts from individual dashboards to the data foundation behind them.
Instead of rebuilding the same business logic separately in every report, define common elements centrally, including:
- Revenue and financial measures
- Customer and product logic
- Date and time calculations
- Security rules
- Shared dimensions and relationships
A typical environment may have separate semantic models for areas such as:
- Finance
- Sales
- Operations
- HR
- Other core business domains
These shared models become the foundation for the reports that follow. They help standardize calculations, apply security consistently, and keep common business definitions in one place.
This phase should also validate:
- Refresh schedules
- Source-system dependencies
- Gateway performance
- Large-data scenarios
- Model performance under production volumes
Tableau typically remains live during this stage while the Power BI models are built and tested.
Phase 4: Migrate the Remaining Reports in Waves
Weeks 13 to 24
Once the core models are stable, the broader report migration can begin.
Grouping reports by complexity usually makes the work easier to plan and gives the team a more repeatable process.
You can typically organize reports into three bands:
- Simple reports: Standard visuals, basic filtering, and limited custom logic
- Medium-complexity reports: Multiple calculated fields, several data sources, or more involved filter behavior
- Complex reports: LOD expressions, table calculations, data blending, parameters, security rules, or advanced interactions
Starting with simpler reports helps the team establish a consistent migration pattern before moving into the more difficult workbooks.
Each report should then follow the same basic process:
- Rebuild it against the agreed semantic model
- Recreate the required filters and interactions
- Compare the results directly with Tableau
- Validate performance
- Resolve any calculation differences
- Get sign-off from a named business owner
That final approval matters. A report may be technically complete, but it should not move into production until the people who rely on the numbers have confirmed that it works as expected.
Phase 5: Run Tableau and Power BI in Parallel
Weeks 25 to 26
Once most of the reporting estate has moved, run Power BI under real production conditions while Tableau remains available as a reference.
This parallel period helps uncover issues that may not appear during development, including:
- Slower performance with production-sized data
- Refresh schedules conflicting with upstream data loads
- Filters behaving differently from Tableau
- Users struggling with new report locations or navigation
- Security or permission issues
- Calculation differences between the two platforms
If Power BI and Tableau return different numbers, review areas such as:
- Calculation logic
- Null and blank handling
- Aggregation behavior
- Filter context
- Underlying data-model relationships
Critical issues such as incorrect numbers, broken security, failed refreshes, or major performance problems should be resolved before cutover.
Smaller usability or formatting issues can usually move into the post-migration improvement backlog.
As reports are validated and users become comfortable with their Power BI equivalents, the corresponding Tableau reports can begin moving toward retirement.
Phase 6: Training, Adoption, and Tableau Cutover
Weeks 27 to 28 and beyond
Completing the report migration is only part of the transition. Users also need to understand how their day-to-day work changes in Power BI.
Training should be based on role.
Report consumers should know how to:
- Find the reports and dashboards they use
- Work with filters and slicers
- Understand refresh behavior
- Export or interact with data
- Get help when something looks wrong
Analysts and report developers need deeper knowledge of:
- Power BI Desktop
- Power Query
- DAX
- Semantic modeling
- Publishing and workspace management
- Governance and security
Adoption should then be measured rather than assumed.
Track:
- How many former Tableau users are actively using Power BI
- Which teams continue returning to Tableau
- Which reports see low adoption
- Where training or functionality gaps are still appearing
Those patterns can help identify whether the issue is user familiarity, missing functionality, or a report that still needs improvement.
Tableau should only be retired once the agreed validation and adoption criteria have been met.
For example, an organization might require:
- All business-critical reports to be approved
- No unresolved critical issues
- 80% of active Tableau users to have consistently moved to Power BI for two consecutive weeks
Support should continue after cutover as well. Questions about report locations, permissions, calculation differences, and unfamiliar workflows often increase once users no longer have Tableau available as a fallback.
Where Tableau to Power BI Migrations Usually Lose Time
Most delays come from a few predictable decisions.
- One is starting with easy dashboards and assuming that effort represents the rest of the estate. The migration looks fast until the team eventually reaches workbooks filled with LOD expressions, blending, or complex security.
- Another is rebuilding dashboards before the semantic model has been properly designed. That often results in the same business logic being recreated differently across multiple reports and then corrected later.
- Validation is another common source of underestimated effort. A report can look almost identical to its Tableau version while returning different numbers underneath.
- Finally, many teams leave Tableau available without defining when it will actually be retired. Users naturally return to the platform they already know, which slows adoption and extends the period in which the organization is paying for both systems.
Final Thoughts
If you are planning a Tableau to Power BI migration, the goal should not be to recreate everything exactly as it exists today. It should be to understand what still matters, simplify what no longer serves the business, and move the right reports without losing trust in the data.
A well-planned migration gives you more than a new BI platform. It gives you a cleaner reporting environment, stronger governance, and a better foundation for future analytics.
If you are ready to assess your Tableau estate and understand what the move could look like, share your details with us and let's start the conversation.
Frequently Asked Questions
How long does a Tableau to Power BI migration take?
There is no reliable timeline based on workbook count alone. Two organizations can each have 100 Tableau workbooks and require completely different amounts of effort depending on calculations, data sources, security, duplication, data modeling, and report complexity.
The best way to estimate your own timeline is to rebuild several of your most complex workbooks first and measure the actual effort required.
Is there an official Microsoft tool to convert Tableau workbooks to Power BI?
No. Microsoft provides Power BI migration guidance, but there is no Microsoft first-party tool that takes a Tableau workbook and converts it directly into a finished Power BI report.
Third-party migration tools can automate parts of the process, but calculations, interactions, security, and report behavior still require human review.
How much cheaper is Power BI than Tableau?
It depends on your user mix.
Based on the published prices used in this article, Power BI Pro costs $14 per user per month, while Tableau Cloud Standard costs $75 for Creators, $42 for Explorers, and $15 for Viewers.
The savings can become particularly significant for organizations with large read-only audiences because qualifying Fabric capacity can allow users to consume Power BI content without every viewer requiring a Pro licence.
Always model the comparison using your actual user roles and negotiated pricing.
Do all Power BI users need a paid licence?
Not necessarily. Authors publishing to shared workspaces generally require Power BI Pro or another qualifying license.
Viewer licensing depends on the workspace and capacity configuration. When reports are hosted on qualifying capacity, users may be able to consume the content with a free license.
That is why the number of authors, editors, and read-only consumers matter when planning Power BI licensing.
What is the hardest part of a Tableau to Power BI migration?
For many organizations, the hardest part is translating and validating the calculation logic.
Tableau LOD expressions, table calculations, data blending, parameters, and filtering behavior do not always correspond directly to DAX or Power BI's semantic model.
A migrated report can therefore look correct while producing different numbers.
Numeric reconciliation should be treated as a formal acceptance criterion for important reports.
Can Tableau and Power BI run in parallel during migration?
Yes, and in most migrations they should. Parallel operation gives teams time to rebuild reports, compare results, validate security, train users, and solve problems before Tableau is retired.
The key is deciding how that parallel period ends.
Define your decommissioning criteria before the migration begins so temporary dual-platform operation does not become a permanent expense.
Recent Posts

Dynamics 365 Activate: Do You Still Need a Migration Partner?
Oct 05, 2026

SAP ECC to Dynamics 365 Finance & SCM Migration Guide
Sep 09, 2026

Late to Upgrade from AX 2012 to Finance and Operations? [A Reality Check]
Sep 07, 2026
Category
Our Expertise



About Author

Aiswarya Madhu
Aiswarya Madhu is an experienced content writer with extensive expertise in Microsoft Dynamics 365 and related Microsoft technologies. With over four years of experience in the technology domain, she has developed a deep understanding of Dynamics 365 applications, licensing, integrations, and their role in driving digital transformation for organizations across industries.
Never Miss News
Want to implement Dynamics 365?
We have plans which will meet your needs, and if not we can tweak them around a bit too!