A Guide to Predictive Forecasting in D365 CE
Apr 20, 2026 Aiswarya Madhu
Here is the thing nobody in sales likes to admit. Most revenue forecasts are not really forecasts, I would call them educated guesses dressed up in a spreadsheet.
Ask any sales guy how they forecast revenue, and you will hear a familiar story. A mix of gut feeling, pipeline stages, and a sprawling Excel spreadsheet that nobody fully trusts. The data is in the CRM but turning that data into a confident prediction has always felt more like guesswork than science.
The uncomfortable truth is that this is not a small problem. XANT Labs studied 270,912 real closed-won opportunities, worth $18.1 billion in combined revenue, and found that only 28.1% of them closed within 5% of what was forecast 90 days earlier. Nearly half were off by more than 50%. The average miss? Over 31%.
Meanwhile, according to a Gartner survey of sales operations leaders, traditional forecasting accuracy typically lands between 60% and 79%, a range that is simply not reliable enough for confident decision-making.
The result? Teams are reactive rather than proactive. Deals slip without warning. And when leadership asks "what are we going to close this quarter?" the honest answer is often "we think, roughly, somewhere around this number."
Dynamics 365 Customer Engagement is changing that story, and with predictive forecasting powered by AI, the gap between data and decision is finally closing.
The AI Forecast Is Already in CE. Your Team Just Is Not Using It.
According to Salesforce's State of Sales Report, 81% of sales teams are already using or experimenting with AI, and individual usage among reps nearly doubled in a single year, from 24% in 2023 to 43% in 2024.
So there is a reasonable chance your team is already somewhere in that number. But the question that actually matters is what your team is using it for.
In most Dynamics 365 CE environments, AI shows up in the same three places. Copilot drafts the follow-up email after a demo. Activity intelligence summarizes the call so the rep does not have to. Lead scoring helps prioritize who to contact next. All of that is useful, and teams are right to use it.
But here is what is happening in parallel. The same rep using Copilot to draft emails is logging their opportunities in CE with close dates pushed out by 30 days every quarter. The manager reviewing those opportunities every Friday is exporting the pipeline to Excel, applying their own judgment column, and sending a forecast number upward that has nothing to do with what CE's forecasting module actually says. The Forecast tab in Sales Hub exists, but nobody opens it.
And this is not unusual. Most CE implementations are configured for pipeline management, not forecasting. The standard forecast columns, Committed, Best Case, Pipeline, are there and being used.
But the Prediction column, the one that generates an AI-based revenue projection from two or three years of historical win and loss data already in the system, either was never added to the forecast layout, or it is there and blank because the underlying data prerequisites were never met, or it is showing a number that the manager overrides every week because nobody explained what the number means or why it is different from the pipeline total.
The data is already in CE. The history is already there. The question is whether the team is actually using it where it matters, or whether the most valuable capability in the system is sitting in a tab that nobody opens.
How to Actually Use Predictive Forecasting in Dynamics 365 CE and What to Watch Out For
Before anything else, understand what this feature is doing at a practical level. Predictive forecasting in Dynamics 365 CE does four things that matter for revenue forecasting:
- It generates an AI forecast at every level of your hierarchy, seller, manager, and leadership, as a Prediction column inside the standard forecast grid
- It explains why that number is what it is through a prediction details pane that breaks it into closed won revenue, predicted from open pipeline, and predicted from new deals not yet created, plus up to five influencing factors
- It refreshes on its own schedule, every seven days, and you cannot force a manual recalculation
- It depends on data readiness and the right licensing, and will show blank if your data is not sufficient
Before You Touch the Configuration, Check These First
The most common reason predictive forecasting underdelivers is that teams try to set it up before the underlying data is in shape. Microsoft is explicit about this: the system acknowledges that CRM data is noisy and sparsely populated, and it builds in fail-safes. If your data does not meet the minimum thresholds, the Prediction column will simply be empty.
What you need at minimum:
- More than 10 closed opportunities with Actual Value and Actual Close Date populated
- Open opportunities with Estimated Value and Estimated Close Date populated
- Opportunity status aligned with Forecast Category. This is the one that quietly breaks the most forecasts. Microsoft ships a workflow that keeps these in sync when an opportunity closes won or lost, and if that workflow has been disabled at any point, your categories will be wrong, and your prediction will reflect those wrong categories
- Opportunity owner must be a system user, not a queue or team. Any opportunity owned by a queue is excluded from the prediction entirely
- For the prediction factors to appear, predictive opportunity scoring must be configured and published first. Scoring requires at least 40 won and 40 lost opportunities in your selected training window
One thing Microsoft specifically calls out as a data quality issue worth taking seriously: opportunity created date should always be before the close date. That sounds obvious, but violations of this distort cycle time and slip patterns that the model relies on. If your team has historically created opportunities and backdated them, that history will skew the model.
The Setup Sequence: Do This in Order
One availability note worth checking before you start: Predictive forecasting is not available in all regions. GCC environments do not support it. Microsoft's documentation has inconsistencies between pages on exactly which regions are covered, so validate directly in your tenant rather than relying on a single documentation page.
This is not a feature you can enable in one click. There is a dependency chain, and skipping steps causes the prediction column to stay blank or show incorrect values.
The reliable sequence Microsoft documents:
- Confirm licensing. Predictive forecasting requires Sales Insights or Sales Premium. It is not available on standard Sales licenses. Assign the licenses before touching any configuration
- Enable premium Sales Insights in Sales Hub by accepting terms in the Sales Insights settings panel. This step is often missed because the feature appears accessible in the UI before it is actually active
- Configure predictive opportunity scoring first. Create and publish a model, set the training window. Microsoft allows 3 months to 2 years, with 2 years as the default. Then, enable auto-retraining every 15 days if your pipeline volume supports it
- Build your forecast configuration in Sales Hub under App Settings. Define hierarchy, schedule, and permissions
- Add the Prediction column to your forecast layout. This column only appears if predictive forecasting is enabled. If you do not see it, step 2 or 3 has not completed correctly
- Activate the forecast and upload quotas using the Excel workbook template Microsoft provides, or via the Forecast API
- Wait approximately 2 hours after first activation for prediction data to populate
What You Should be Looking at Once It Is Running
The forecast interface has three views. Each one shows a different layer of the same data.
The Grid view is where the Prediction column appears alongside your standard forecast columns.
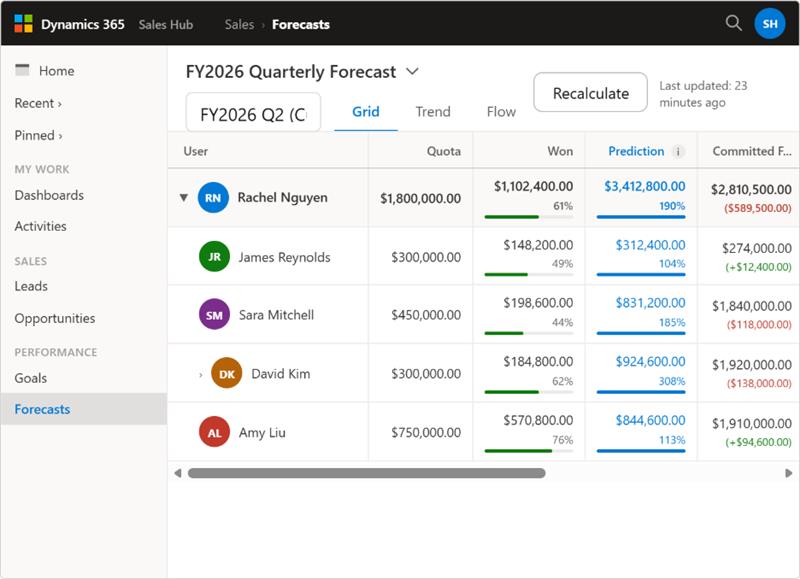
What to look at here is not the Prediction number in isolation. It is the gap between the Prediction and what your reps have entered in their Committed column. A rep with $340,000 in Committed and a Prediction of $150,000 is a conversation waiting to happen. That gap is the signal the AI is giving you before the end of the quarter forces it.
The Trend view shows four lines running across the quarter: actual revenue, predicted realization, prediction, and quota, with a Prediction breakdown panel on the right side.
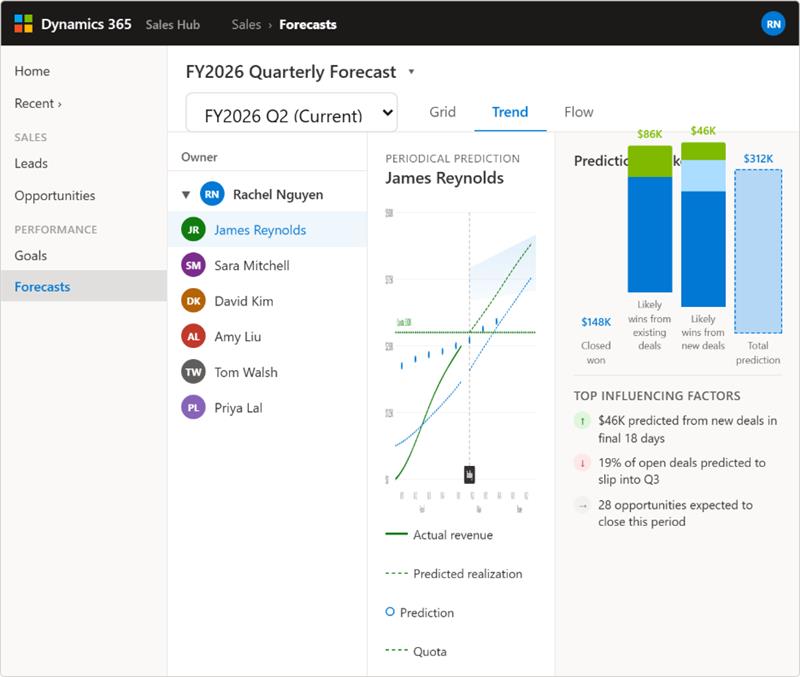
The breakdown panel is the most useful thing in the Trend view. It splits the total prediction into three components:
- Closed won: revenue already booked in the current period
- Predicted from open: what the model expects to close from your existing pipeline
- Predicted from new: revenue from deals that do not exist in the pipeline yet, projected from historical patterns in how your quarters typically develop
That third number, predicted from new, is what most sales leaders have never had access to before. It is not based on anything your reps have entered. It is the model looking at how Q2 has historically developed in your organization and projecting what is likely to surface.
Below the breakdown chart, up to five influencing factors appear, each marked positive, negative, or neutral. A negative factor saying "22% of open opportunities are predicted to move into Q3" is not a data artifact. It is the model identifying a risk that your pipeline view does not surface on its own.
The Flow view shows how opportunities are expected to move across the quarter through your pipeline stages.
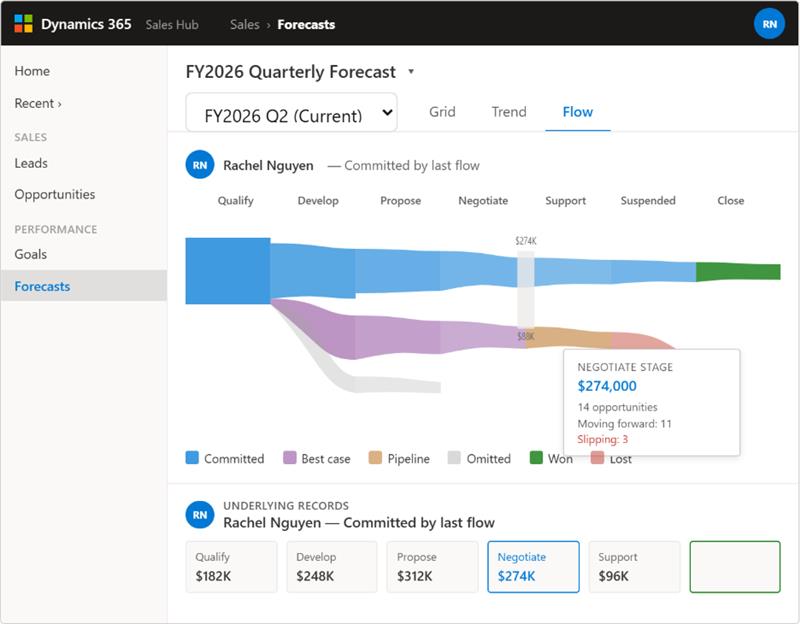
The Flow view is most useful for spotting where volume is concentrating in the quarter. If 60% of your committed pipeline is still in the Negotiate stage with 18 days left, the Flow view surfaces that concentration before it becomes a missed quarter. At that point a sales leader can push resources into accelerating those specific deals, adjust the forecast, or have a direct conversation with the reps involved, rather than discovering the problem on the last Friday of the month when there is nothing left to do about it.
The Recalculation Reality and Why It Matters for How You Use This
The Prediction column refreshes every seven days. You cannot speed this up. You cannot force a recalculation.
This has a practical implication for how you structure your forecast review rhythm. If your weekly pipeline review happens on Monday and the prediction last recalculated on Friday, you are working with a signal that is three days old. That is usually fine for stable pipelines. If your quarter is moving fast, a large deal slips, a new one comes in, the model will not reflect that until the next seven-day cycle runs.
The rest of the forecast grid does recalculate more frequently. Pipeline changes, stage updates, and forecast category changes flow through quickly. The delta between what the grid shows and what the Prediction shows in those fast-moving moments is worth understanding as context, not treating as a bug.
Limitations You Need to Know Before You Go Live
Most of these will not surface in a demo environment. They surface in production when something does not behave the way you expected.
- Cold start. If your data does not meet the minimum thresholds, the Prediction column is empty. No error message. No explanation. Just blank. This is the most common first-week issue
- Opportunity-only rollups. The prediction is built on opportunity data only. If your team tracks revenue through anything other than opportunities, those numbers do not contribute to the prediction
- Weekly lag. Sudden market shifts, large deals closing or falling out, significant pipeline changes in the middle of a week will not be reflected until the model next recalculates
- Sparsity at lower levels. The model performs better at aggregate levels than at individual rep level. Predictions for a rep with 15 opportunities in the period will be less reliable than predictions for a team of ten
- Forecasting is not supported on mobile. If your managers review forecasts on their phones, they will not see the prediction column
- Several historical visualization features are deprecated. Forecast snapshots were removed June 30, 2024. Week-over-week comparison over time now needs to be built externally using the Forecast API
Common Pitfalls Worth Getting in Front of Now
These are documented by Microsoft as real operational problems that teams hit after go-live:
- Territory hierarchy disabled after an update. This silently breaks the forecast hierarchy. The fix is re-enabling the hierarchical relationship for territory, but finding the cause takes time if you do not know what to look for. The way to catch it proactively is to check whether your forecast hierarchy is reflecting the correct rollup after any system update. If a manager's total does not match the sum of their direct reports, the hierarchy is likely broken.
- Forecast category mapping workflow disabled. Categories stop updating when opportunities close. The prediction model continues running on stale categories. Reactivating the workflow fixes it but does not retroactively correct historical records. To catch this before it affects the model, periodically check whether recently closed opportunities have had their forecast category updated to Won or Lost. If closed deals are still showing as Pipeline or Committed, the mapping workflow has stopped running.
- Users unable to drill down into underlying opportunities. This one usually gets reported as the feature not working. A user clicks on a forecast number expecting to see the deals behind it and nothing happens, or they get an access error. It is not a bug. It is a permissions issue. Someone on the admin side needs to check the security roles and make sure the relevant users have access to the Forecast Configuration entity. Once that is updated the drill-down works immediately. If your team is reporting this, go to security roles before raising a support ticket.
- Managers trying to force a prediction refresh. This comes up almost every week in teams that are new to the feature. A manager sees a prediction they do not trust, wants to update it with the latest pipeline data, and goes looking for a way to trigger a recalculation. There is no such option. The prediction recalculates automatically every seven days and that cadence cannot be changed or overridden. The most useful thing you can do is set that expectation with your team early so nobody spends time looking for something that does not exist, and so managers understand that a prediction that looks stale may simply be mid-cycle rather than broken.
What the Business Impact Actually Looks Like
Forrester's TEI study commissioned by Microsoft puts some numbers behind what most sales leaders already suspect is possible:
- 215% ROI with a 7-month payback period
- $13.3 million in seller productivity gains for the composite organization
- $4.7 million in sales manager productivity
- Explicit callout that a more reliable pipeline improves how finance and operations plan downstream, not just how sales calls the quarter
The numbers are useful context. The more honest description of the impact is what changes inside the forecast review meeting every week.
Most mid-market sales teams running 400 or so active opportunities per month spend the first half of every forecast call debating whether the number is right. Someone built it from a CRM export, applied their own adjustments, and sent it up. Someone else questions a rep's deal. The manager defends it. Forty-five minutes later, the team has a number they half-believe and a conversation they will repeat next week.
What changes when predictive forecasting is running properly is not the number. It is what the meeting is about. The prediction is already there. The factors driving it are already visible. The conversation moves directly to what needs attention: which deals are flagged as likely to move out, where the late-quarter concentration is building, what new deal flow the model is projecting for the final three weeks.
The Pilot Checklist: Work Through This in Sequence
Confirm Sales Insights or Sales Premium licensing is assigned to all relevant users
- Enable premium Sales Insights by accepting terms in Sales Hub settings
- Run a data readiness check. Confirm Opportunity Estimated Value, Estimated Close Date, Actual Value, and Actual Close Date are populated on your historical records
- Verify that the forecast category mapping automation is active and has not been disabled
- Check that opportunity created date is consistently before close date across your records
- Configure predictive opportunity scoring. Choose training window, publish model, enable auto-retraining
- Configure forecast model. Set hierarchy, schedule, and permissions
- Add Forecast Category columns and the Prediction column to the forecast layout
- Activate forecast and upload quotas via the Excel template or API
- Wait approximately 2 hours, then validate that the Prediction column is populated and review initial factors
- Define your success metrics before the pilot ends: forecast error versus actual, cycle time for forecast submission, percentage of opportunities missing close date or value, and user adoption rate
Beyond the CRM: Extend Predictions to Other Systems
One of the most underused capabilities in Dynamics 365 CE predictive forecasting is that the data does not have to stay inside the CRM. Because forecast data lives in Dataverse, it is accessible to every other system in your stack through several routes that are already available if you are running the Microsoft ecosystem.
The practical options are:
- Forecast API (msdyn_ForecastApi) retrieves and pushes forecast data programmatically, including point-in-time snapshots for week-over-week comparisons that the native UI no longer supports since snapshots were deprecated in June 2024
- Azure Synapse Link for Dataverse continuously exports forecast and opportunity tables to Azure Data Lake, where finance and operations teams can build downstream analytics and machine learning pipelines on top of live CRM signals
- Power Automate riggers actions in external systems the moment a forecast condition is met. For example, when a rep's Committed column diverges from the AI Prediction by more than 20%, Power Automate can automatically send a notification to the manager in Teams flagging the gap before the weekly review. The same logic applies to a deal probability dropping below a threshold, a predicted-from-new number crossing a value, or any other forecast signal that should not wait for someone to notice it manually.
- Power BI connects directly to Dataverse and surfaces forecast data in dashboards that supply chain, finance, and operations teams consume without ever opening the CRM
So, What's Next ?
The tool/feature is already there. Two years of closed deal data in the system, win rates by stage, by rep, by deal size. The AI capability switched on. The dashboards look polished. And the forecast still off by 30 percent at the end of the quarter because the model was never properly configured, and the team kept overriding it with the same gut-feel adjustments they were making before any of this existed.
That is where most teams are. The gap is not a technology problem. It is a configuration and process problem.
If your forecasting still leans more on instinct than data, if the feature is already switched on but the numbers feel off, or if you want to understand how to bring these signals into Business Central or your wider reporting stack, those are worth a conversation.
Schedule a free 30-minute call with our Dynamics 365 CE experts. We will look at where your current setup stands and help you understand what it would take to get this working the way it should.
Recent Posts
Business Central Payables Agent [What Finance Teams Need to Know]
Jul 16, 2026

Business Central Expense Management [The Complete Guide]
Jun 29, 2026

Top 5 Best CRM Software for Healthcare Industry [2026 Updated List
Jun 18, 2026
Category
Our Expertise


About Author

Aiswarya Madhu
Aiswarya Madhu is an experienced content writer with extensive expertise in Microsoft Dynamics 365 and related Microsoft technologies. With over four years of experience in the technology domain, she has developed a deep understanding of Dynamics 365 applications, licensing, integrations, and their role in driving digital transformation for organizations across industries.
Never Miss News
Want to implement Dynamics 365?
We have plans which will meet your needs, and if not we can tweak them around a bit too!