Dynamics 365 Business Central Power BI Integration [A Complete Guide]

Dynamics 365 Business Central Power BI Integration [A Complete Guide]

Jan 07, 2026 Aiswarya Madhu

According to Forrester’s TEI study, companies are achieving up to 265% ROI over three years, saving over $500K in net present value just from improved analytics. That’s not a small gain, it’s a clear shift in how modern businesses operate. With productivity boosts ranging from 9 to 18%, teams are moving from reactive reporting to proactive, data-led decisions.

This transformation isn’t happening in silos. It's the result of smart integrations, where finance, operations, and sales are no longer disconnected, and insights flow seamlessly across the business. One integration making this possible for small and mid-sized businesses is Microsoft Dynamics 365 Business Central Power BI integration.

Here we’re going to explore how this Power BI Business Central integration works, the kind of value it brings, and why more SMBs are making the switch.

Prerequisites for Business Central Power BI Integration

Before moving into the integration process, ensure you have the necessary prerequisites in place. These differ slightly for Business Central Online (cloud) versus Business Central On-Premises deployments:

Business Central Online (Cloud)

The cloud version of Business Central has native Power BI integration enabled by default. All you need is a Power BI account. In fact, a free Power BI license is often included with your Business Central subscription, which allows basic usage. (For full functionality like sharing reports or advanced features, a Power BI Pro license is recommended, which may need to be purchased separately.) Ensure that the user account you’re using has access to the Business Central data (environment/company) you intend to analyze.

Business Central On-Premises

For on-prem installations, additional setup is required to allow Power BI to fetch data. First, you must expose Business Central data via web services – this can be done by publishing API pages or OData V4 web services for the data you want to report on. Make sure OData web services are enabled on your Business Central server (including the OData V4 endpoint). Next, you’ll typically need to register an application in Azure Active Directory (AAD) for Business Central, so that Power BI can authenticate and query the on-prem data securely.

This Azure app registration is also necessary if you plan to embed Power BI reports within Business Central pages on-premises (it establishes trust between BC and Power BI). Additionally, if you will use the Power BI cloud service to view reports (as opposed to just Power BI Desktop), you should install and configure an On-Premises Data Gateway to allow the cloud Power BI service to securely refresh data from your local Business Central database.

Finally, ensure the user credentials you use for Power BI have appropriate permissions to read the Business Central data (either through Office 365 accounts for BC Online or Windows/AAD credentials for on-prem).

Learn how Power BI Salesforce integration turns CRM data into actionable dashboards for sales, service, and leadership teams.

How to Integrate Business Central with Power BI

Once the prerequisites are in place, connecting Business Central to Power BI is straightforward. Broadly, there are two main methods to integrate and retrieve your data, depending on your needs:

how to integrate business central with power bi
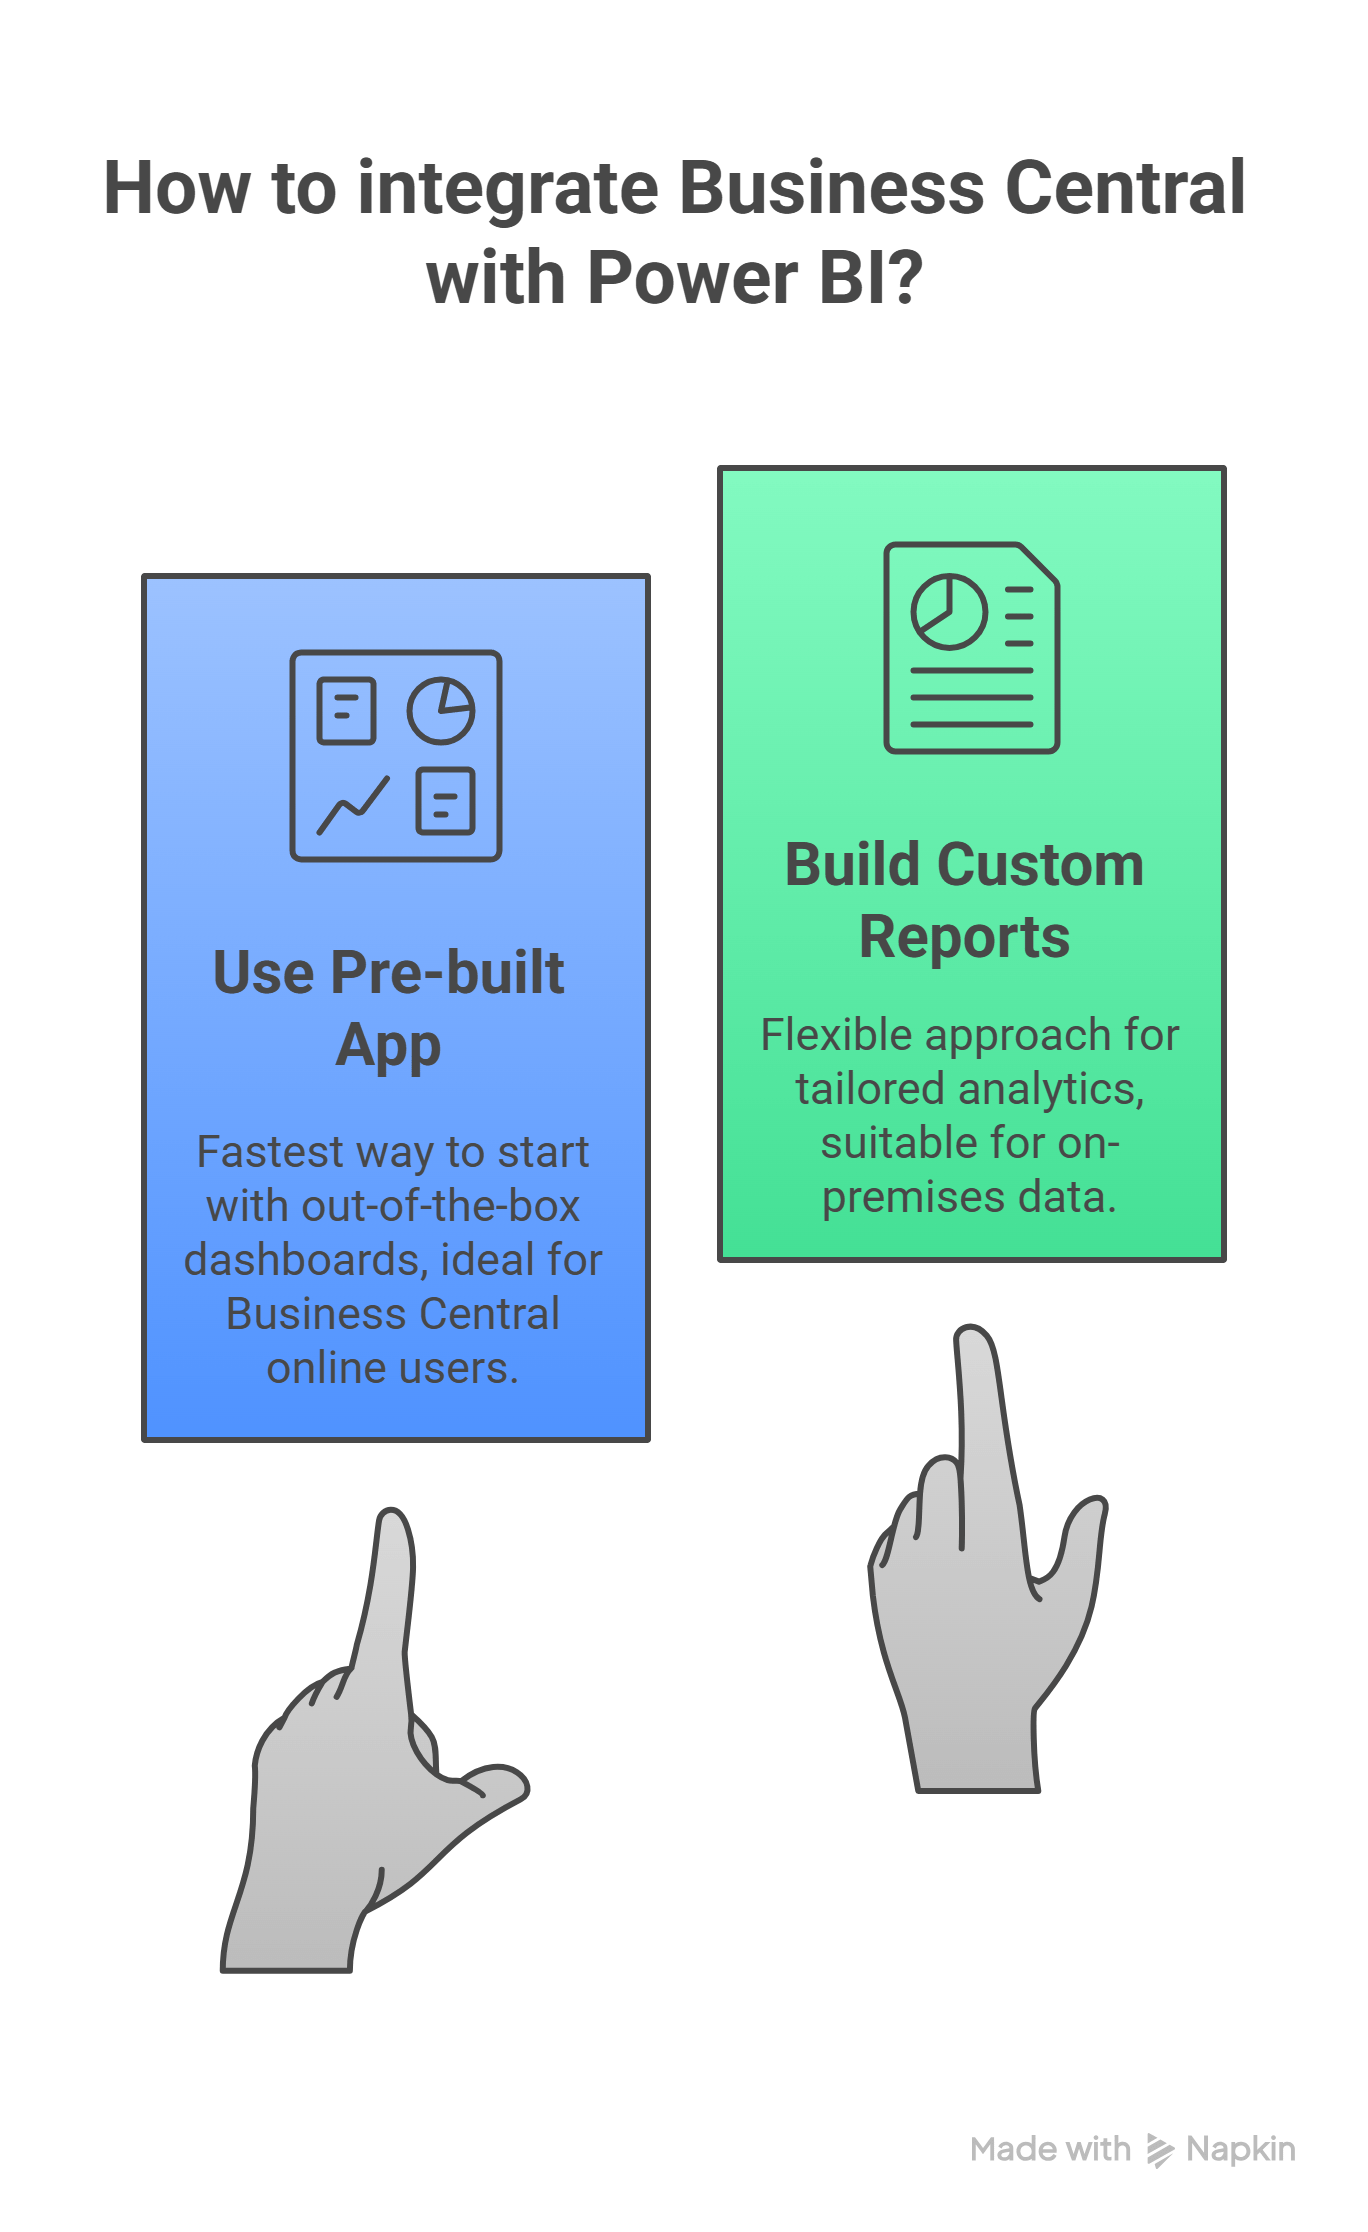
  • Using the Pre-built Power BI App for Business Central – the fastest way to get started with out-of-the-box dashboards (ideal for Business Central online users).
  • Building Custom Reports with Business Central Data (OData or APIs) – a flexible approach for tailored analytics or on-premises data.

We’ll outline both methods below.

Option 1: Using the Power BI Content Pack (Pre-built App)

Microsoft provides an official Power BI app for Dynamics 365 Business Central, which includes a set of pre-built dashboards and reports. This is the simplest way to jumpstart your analysis if you are using Business Central online (SaaS):

Open Power BI and find the app: Log in to the Power BI service (powerbi.com) or launch Power BI Desktop. In the Power BI Service, navigate to the Apps section on the left menu and click Get Apps. In the AppSource marketplace, search for “Dynamics 365 Business Central”.

Get the Business Central app: Locate the Microsoft Dynamics 365 Business Central app in the results and click Get it now. If prompted, sign in with your Office 365 work account (the same account tied to your Business Central).

Choose environment and data: After the app installs, you will be asked to configure it. Select your Business Central Environment (e.g. Production or Sandbox), and the Company you want to connect to. Then enter your Business Central credentials (Organizational Account with the necessary privileges). Finally, choose the dataset you want to load – for example, Sales, Finance, CRM, etc., depending on the app’s focus.

Load and view reports: The app will connect to Business Central and automatically populate a set of ready-made reports and dashboards with your data. This may take a few minutes for the initial load. Once done, you can view the Finance, Sales, Inventory, or other available dashboards that come with the app, now reflecting your company’s live data. The reports are interactive – you can click on visuals to filter and drill down.

Customize or share (optional): You can customize these out-of-the-box reports to better fit your needs – for example, edit visuals or add new calculated measures. When you’re satisfied, you can share the app's dashboards with colleagues straight from Power BI or even embed them into Business Central’s Role Center for easy access (we’ll touch on embedding shortly).

Option 2: Building Custom Power BI Reports with Business Central Data

For more advanced analytics needs, or if you are connecting to Business Central On-Premises, you can create custom Power BI reports using Business Central as a data source via OData or APIs. This method gives you full control over which data to pull and how to model it:

Expose data from Business Central: Decide which data you want to analyze (e.g., sales orders, G/L transactions, item inventory, etc.) and expose it as an OData feed or API. In Business Central online, many standard feeds are available out-of-the-box (for example, the web services for common tables). You can find these by searching for Web Services in Business Central and copying the OData URL for the desired data set. If the data isn’t already exposed, you may publish a new Web Service for a page or query (developers can also create API pages/queries for more complex data). For instance, on any list page in Business Central, you can use the “Edit in Excel” action – this will generate an OData URL that you can copy for use in Power BI. (In on-premise BC, ensure the OData service is enabled and reachable over your network or via the gateway.)

Connect Power BI to the OData feed: In Power BI Desktop, go to Get Data and choose OData Feed (Power BI also has a Dynamics 365 Business Central connector, which under the hood uses OData – you can use that for Business Central Online by simply logging in with your credentials as prompted). Paste the OData URL you obtained from Business Central. When prompted about authentication, choose Organizational Account (OAuth2) and sign in with your Business Central user account (for cloud BC, this is your Office 365 account; for on-prem, it might be Windows or AAD credentials, depending on your setup). Power BI will then connect and fetch the data.

Transform and model the data: The data from the OData feed will appear in Power BI’s Power Query Editor. Here you can transform the data as needed – for example, rename columns, filter out unnecessary records, or merge data from multiple feeds (perhaps joining Sales header and line feeds, etc.). This is also the time to build any relationships between different Business Central tables you’ve imported (e.g., relate sales lines to the items table, or G/L entries to the chart of accounts) to create a proper data model for reporting.

Create your reports and visuals: With the data loaded into Power BI, you can start creating your custom reports. Use drag-and-drop to add charts, tables, and other visuals to represent your Business Central data. Because you’re working with live data (or periodically refreshed data), you can design dashboards that answer your specific business questions – whether it’s an Accounts Receivable aging chart, a project profitability report, or operational KPIs not covered by the standard app. Utilize Power BI features like measures, DAX calculations, and custom visuals to enrich your analysis as needed.

Publish and share: Once your reports are ready in Power BI Desktop, you can publish them to the Power BI Service (if you intend to share with others or embed in Business Central). In the Power BI service, set up a scheduled refresh for your dataset – for Business Central online data, you simply need to provide credentials and schedule (since it’s cloud-to-cloud). For on-premises data, ensure the On-Premises Data Gateway is configured; the dataset should be mapped to use that gateway for refresh. After publishing, you can share the reports or add them to Power BI workspaces and apps for distribution.

Authentication Tip: When connecting Power BI to Business Central APIs/OData, always use OAuth2 (organizational account) when possible for security. Older versions of Business Central on-prem may allow using a Web Service Access Key (a sort of password for web service endpoints) for Basic authentication, but this is not recommended if OAuth is available, especially for cloud environments. Using Azure AD authentication ensures your data is accessed securely and respects the proper user permissions.

Need Help Getting Your Business Central Power BI Integration Right?

What to Do After Integrating? [Tips to Scale Insights]

Embed Power BI in Business Central: Business Central allows you to embed Power BI reports directly into its Role Centers and List pages as FactBoxes. This means a user working in BC can see relevant Power BI analytics in context.

For example, on a Customer List page, you might show a Power BI chart of that customer’s sales history; on the Items List, you could display an inventory KPI dashboard. The integration is smart – when you select a specific record in Business Central (say a particular customer), the embedded Power BI report can filter to show data just for that record.

To set this up, publish your report to the Power BI Service and then use the Power BI FactBox part in Business Central to select the report you want to display on a given page. This seamless embedding greatly enhances the user experience, letting users toggle between operational data and analytical insights without leaving Business Central.

Security note: the data shown will respect Business Central’s security since the Power BI report is using the logged-in user’s credentials.

Access reports on the go (and in Teams): Because Power BI is cloud-based, all your Business Central-connected reports can be accessed on the Power BI mobile app (useful for executives who need to check metrics on phones/tablets). Moreover, you can integrate these reports into Microsoft Teams channels or chats.

For instance, your finance team’s Teams channel can have a Power BI tab showing a live Financial dashboard. Team members can discuss the numbers right within Teams, leading to quicker, well-informed decisions.

This integration of Power BI content into Teams leverages your Business Central data beyond the ERP interface, enhancing collaboration. Similarly, Power BI reports can be embedded in SharePoint pages or viewed in Excel (using the Power BI Excel add-in), providing flexibility in how and where users consume insights.

Combine Business Central data with other sources: Once your Business Central data model is in Power BI, you can mash it up with over 500+ other supported data sources. Want to correlate sales from BC with website analytics from Google Analytics, or with CRM opportunities from Dynamics 365 Sales?

Power BI makes this possible in a single report. You could, for example, blend BC’s sales data with market trends from a CSV/external API to see how external factors drive your revenue. This ability to unify data gives you a more complete picture and insights that wouldn’t be visible in siloed systems. Power BI’s integration capability is a big reason it’s considered a leading BI tool.

Future-proof scalability: As your data grows, you can implement practices like incremental data refresh in Power BI (loading only new data after initial load) to handle large Business Central datasets efficiently.

Also, if you upgrade or customize Business Central (adding new fields, custom tables, etc.), you can adjust your Power BI queries to accommodate those changes. The integration is flexible and designed to scale with your business needs.

Always follow best practices in Power BI data modeling (such as using star schemas for performance) to get the best results from analyzing your Business Central data. If needed, consider seeking guidance from a Power BI expert or partner to optimize complex models or large data volumes.

Explore how the right Dynamics 365 Power BI integration strategy drives faster decisions and measurable ROI.

Use Cases for Business Central Power BI Integration

Integrating Power BI with Business Central opens up powerful analytics scenarios across all areas of your business. Here are some practical use cases and examples of what you can do with this integration:

Financial Performance Monitoring

Let’s consider a common finance scenario.

It is the middle of the month. The CFO senses that cash flow feels tighter than expected, even though sales have not dipped. Instead of waiting for the month-end close or asking the team to prepare a report, they open a Power BI dashboard directly inside Business Central.

The dashboard shows live revenue, expenses, margins, and cash position as of today. A cash flow trend highlights that outgoing payments are accelerating faster than incoming receipts. The CFO clicks into the receivables section and immediately sees several high-value invoices past due. Switching to payables reveals that a group of vendor payments is scheduled earlier than usual.

Filtering by department shows one cost center trending above budget. Drilling down exposes the exact transactions driving the variance, all pulled directly from the general ledger. There is no spreadsheet handoff and no reconciliation delay.

Because the data refreshes continuously, the finance team sets alerts on cash thresholds and budget overruns. Instead of discovering issues at month end, they adjust spending and collections during the month. Financial reviews shift from reactive explanations to proactive control.

Sales and Customer Insights

Now shift to a sales leadership scenario.

A sales director wants to know whether the team is on track to hit quarterly targets, but also wants to understand which products and customers are actually driving profit, not just volume.

Opening the Power BI sales dashboard, they see live sales by product, region, and customer segment. One product line is selling well in volume but delivering thinner margins. Another, with lower volume, is driving disproportionate profit. A regional heatmap shows strong demand in one market that was not part of the original campaign focus.

The director clicks into the pipeline view and sees a concentration of deals stuck at the same stage. Drilling down reveals that pricing approvals are slowing progress. This insight prompts an immediate adjustment to the approval workflow rather than waiting for the quarter to close.

Sales forecasts, powered by historical data and trend models, show a shortfall forming in the final month. With time still available, the team launches a targeted campaign aimed at the highest-margin customer segment.

Sales decisions happen while outcomes can still be influenced, not after results are locked in.

Inventory and Supply Chain Management

Next, consider an operations manager responsible for inventory across multiple locations.

Instead of reviewing a weekly stock report, they rely on a Power BI dashboard that updates throughout the day. Stock levels are displayed by item and warehouse, with visual indicators highlighting items nearing reorder points.

One fast-moving product shows declining availability in a key location. Clicking into the item reveals a recent spike in regional demand. The dashboard also shows that the primary supplier’s lead time has increased slightly over the past month.

Before a stockout occurs, the manager adjusts reorder quantities and routes replenishment from another warehouse. Aging inventory visuals reveal slow-moving stock elsewhere, prompting a promotion to free up capital.

Supplier performance metrics show one vendor consistently missing delivery targets. This data becomes part of the next supplier negotiation, backed by actual performance history rather than anecdotal feedback.

Inventory decisions move from periodic reviews to continuous optimization.

Project and Job Costing

For project-based teams, Power BI changes how job performance is monitored.

A project manager opens a dashboard showing budget versus actuals across active projects. One project appears healthy at first glance, but a closer look shows that 70 percent of the budget is consumed while only 50 percent of the work is complete.

Drilling down reveals that a specific role is logging more hours than planned and that material costs are trending higher than forecast. Using a simple scenario view, the manager evaluates the impact of reallocating resources and adjusting timelines.

Because these insights appear mid-project, corrective action happens before profitability is lost. Portfolio-level views help leadership compare project margins and prioritize the most valuable work.

Operational Dashboards

Across the organization, different roles see different dashboards embedded inside Business Central.

Finance teams monitor receivables and cash exposure. Sales teams track open orders and pipeline movement. Warehouse supervisors view picking efficiency and shipment status. Executives see a unified view that connects sales demand, inventory availability, and financial impact.

Because everyone is working from the same live data, conversations become faster and more aligned. There is less debate about whose numbers are correct and more focus on what actions to take next.

Forecasting and Planning

Finally, consider planning and forecasting.

Instead of relying solely on last year’s numbers, leadership reviews forecasts generated from live Business Central data. Sales, demand, and cash flow projections update as actuals change.

Scenario analysis allows teams to ask practical questions. What happens if demand increases in one region. What if supplier costs rise. What if hiring is delayed by a quarter. Each scenario updates financial and operational outcomes instantly.

Because forecasts are shared across finance, sales, and operations, planning becomes collaborative. Adjustments happen continuously, not just during annual budgeting cycles.

Quick Wins: The First 5 Power BI Dashboards to Build with Business Central

After integrating Power BI with Dynamics 365 Business Central, the biggest mistake teams make is trying to build too much, too fast. The real value comes from starting with a small set of dashboards that answer everyday business questions clearly and reliably.

A simple rule applies here: five dashboards everyone relies on are far more valuable than fifty that no one trusts. These five dashboards consistently deliver the fastest return after integration.

Cash Flow Forecast Dashboard

Cash flow visibility is usually the first reason finance teams turn to Power BI. A cash flow forecast dashboard brings together receivables, payables, and projected inflows and outflows into a rolling view, often spanning 8 to 13 weeks.

Instead of waiting for month-end cash reports, finance leaders can see how upcoming vendor payments, delayed receivables, or unexpected expenses will impact liquidity. Scenario views allow teams to model what happens if collections slow or large payments shift earlier than planned. Alerts can be configured to notify stakeholders when projected cash falls below defined thresholds.

Organizations using this approach have reported significant improvements in forecast accuracy and avoided cash shortfalls by identifying issues weeks earlier than traditional reporting would allow.

Accounts Receivable Aging by Customer

An interactive AR aging dashboard helps finance and collections teams focus on the customers that pose the highest risk to cash flow.

Rather than reviewing static aging reports, teams can visualize overdue balances by customer, aging bucket, region, or salesperson. Heat-based visuals quickly highlight accounts that are trending toward delinquency. Drill-down views make it easy to move from a summary view into individual invoices and payment histories.

This targeted approach reduces time spent chasing low-risk accounts and helps shorten Days Sales Outstanding by focusing effort where it matters most.

Sales vs Target by Product

Sales performance dashboards built on Business Central data allow leaders to compare actual revenue against targets at a granular level.

A sales-versus-target dashboard shows which products or product categories are outperforming expectations and which are falling behind. Filters allow users to slice performance by region, customer segment, or salesperson, while trend views compare current performance to prior periods.

This level of visibility helps sales teams adjust strategy while the quarter is still open, rather than explaining shortfalls after targets are missed. It also helps leadership understand not just where revenue is coming from, but where margins are strongest.

Inventory Turnover and Stock Efficiency

Inventory dashboards are often the fastest source of cost savings after integration.

A Power BI inventory dashboard tracks turnover rates, days inventory outstanding, slow-moving stock, and stock levels by location. Visual alerts highlight items that are overstocked or approaching obsolescence. Trend views help operations teams understand how purchasing and demand patterns are affecting working capital.

Organizations using these dashboards have reduced excess inventory, improved cash availability, and lowered carrying costs by acting on insights that were previously buried in spreadsheets or reviewed too infrequently.

Project Budget vs Actuals

For businesses using Business Central Jobs or Projects, a budget-versus-actuals dashboard is essential.

This dashboard compares planned costs to actual spend and progress in real time. Project managers can immediately see when costs are running ahead of completion, identify which resources or expense categories are driving overruns, and take corrective action early.

By catching margin erosion during execution rather than after project close, teams protect profitability and improve delivery discipline across the project portfolio.

A Faster Start with Pre-Built Power BI Apps

Microsoft provides pre-built Power BI apps for Business Central covering finance, sales, inventory, and projects. These apps can be installed directly from AppSource and embedded into Business Central role centers.

They provide a strong starting point for the dashboards above and can be customized over time as reporting needs mature. For many teams, these templates shorten the time to value from months to weeks.

Explore the case study to see how automated sales cadence and real-time dashboards transformed pipeline performance.

Conclusion

Power BI can significantly expand the value of Dynamics 365 Business Central, but only when the integration is done right. Connecting data is just the first step. Real impact comes from designing dashboards, security, data models, and automation in a way that aligns with how your teams actually work.

That is why expert guidance matters. An experienced integration partner helps ensure the solution is built around your business requirements, scales as your data grows, and delivers insights you can trust.

About Author

Never Miss News

Want to implement Dynamics 365?


We have plans which will meet your needs, and if not we can tweak them around a bit too!

Field will not be visible to web visitor